The Editorial Performance Board evaluates the content impact in the context of the audience acquisition journey and subscription revenues
The content is organized into three main analytical use cases:
-
Understand the new subscription revenue in the context of site traffic and content that is being produced.
-
Compare the readership preferences and browsing behavior for most important audience segments such as “Anonymous” visitors, “Known users without access” to restricted content, and “Subscribers” with the ability to alter the segments
-
Analyze the impact of acquisition strategies in the context of articles and identify which content attributes have better total and relative performance results.
-
Learn additional insights about content impact on subscription revenues by analyzing additional data coming from Audience - Content profiles.
The board defaults to a time period of the past 7 days, with period comparison enabled.
Overview tab
KPI tiles
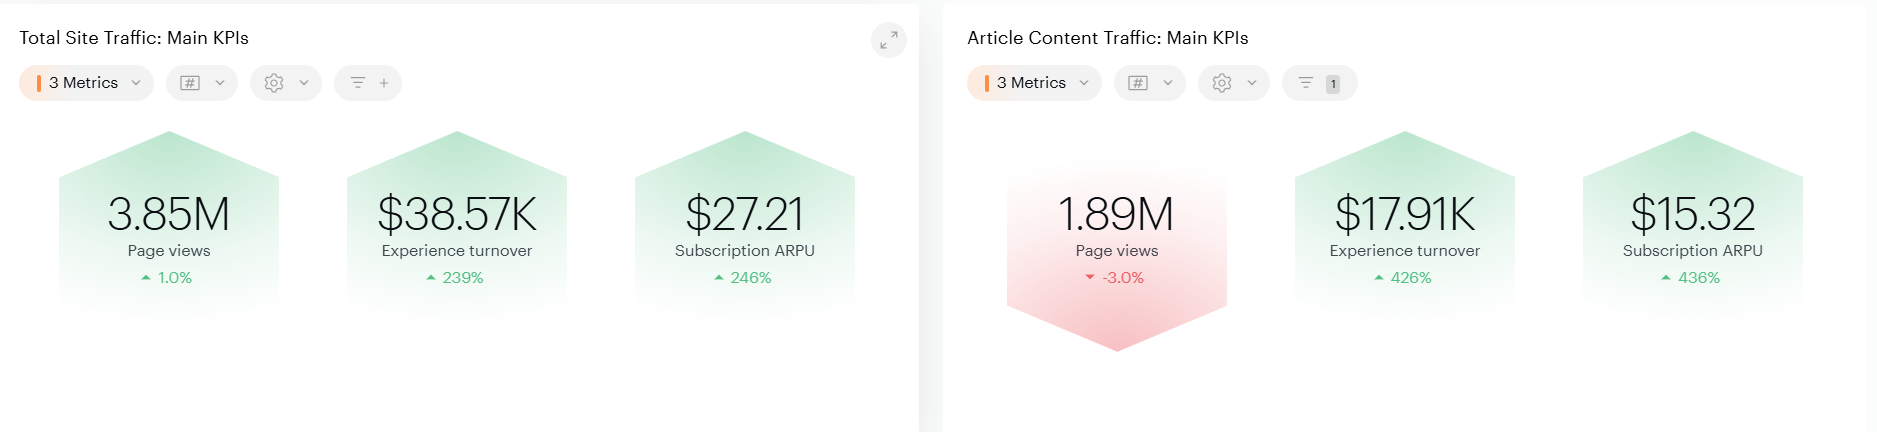
The KPI tiles help to highlight the most important data points regarding audience traffic and new revenue. There are two tiles displayed side by side: the first tile considers all types of content, while the second is filtered specifically for article content type.
-
Total Site Traffic: Main KPIs provide insights into the overall traffic volume and new subscription revenues. A key KPI to track over time is the Subscription ARPU, which represents the average new subscription revenue per 1,000 visitors to the website.
-
Article Content Traffic: Main KPIs focus on a subset of traffic specific to articles, identified using the “content type” meta tag in your data. By comparing the two KPI tiles side by side, you can understand the proportion of traffic and content that is relevant for total site traffic versus article-specific traffic.
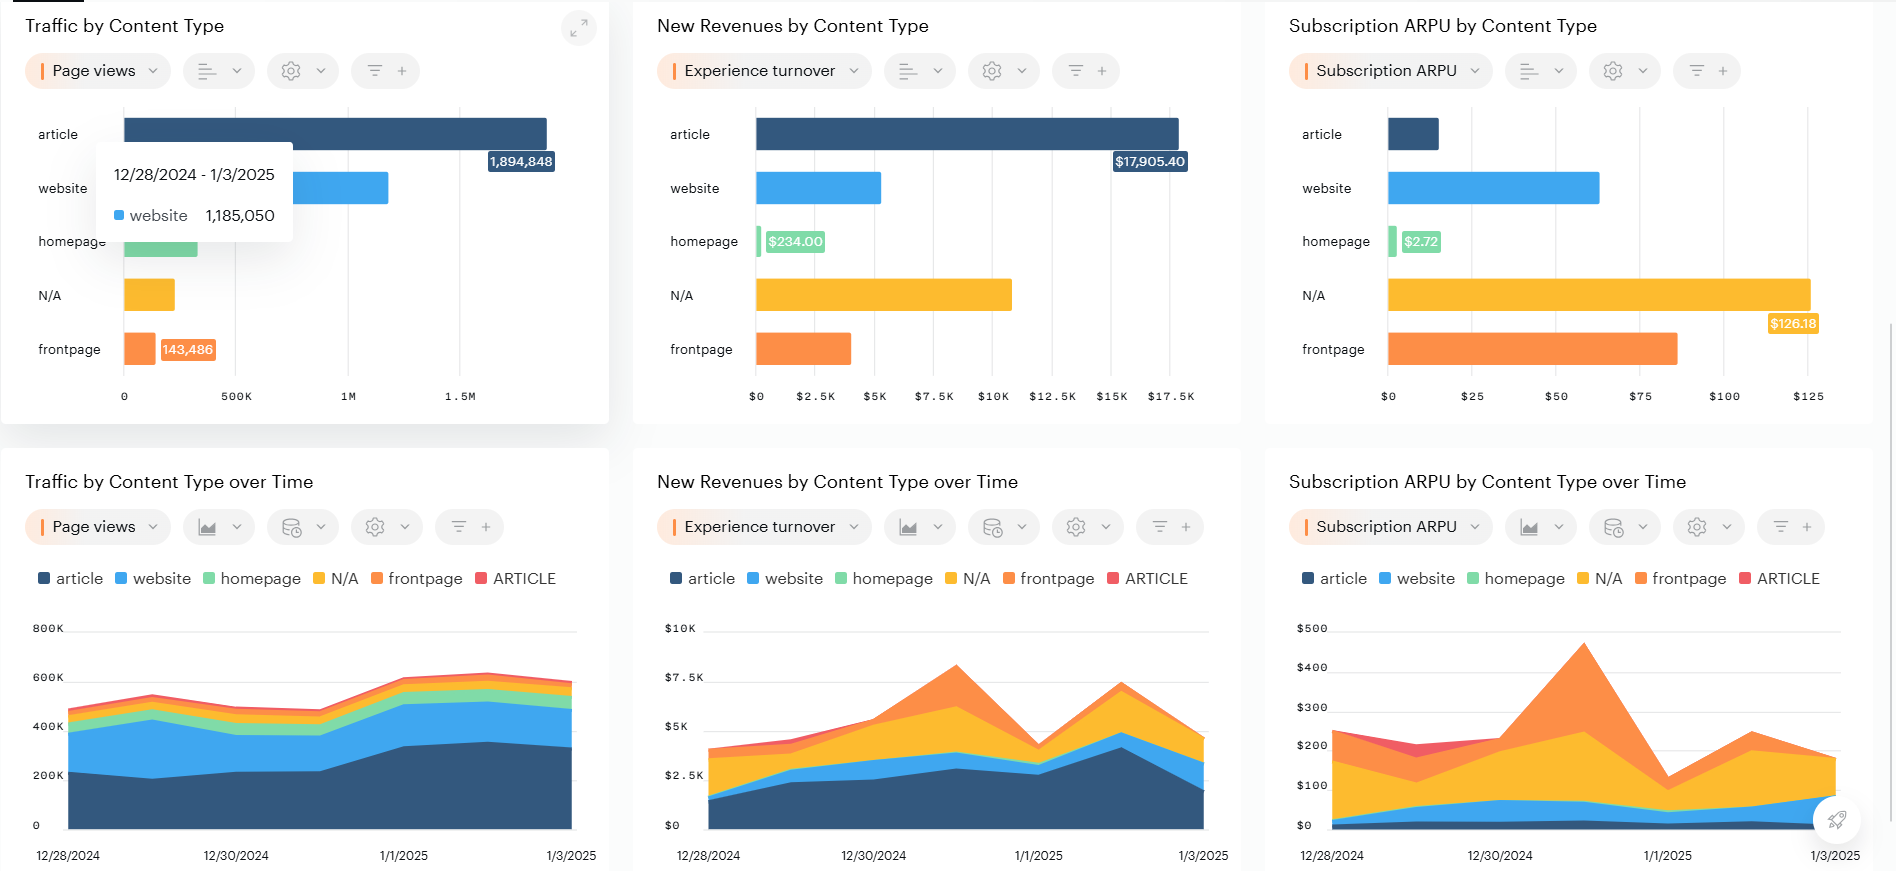
Bar and timeline charts
If you want to understand how content is being tagged and the traffic or revenue associated with it, refer to the set of charts below the KPI tiles. These charts reflect how conversions are attributed to articles, landing pages, or other content types.
If there is a significant portion of “N/A” values, we recommend addressing this by refining the data definitions in the Composer or PA SDK. To learn more check our documentation.
Audiences
Gaining insights into audience behavior differences—such as editorial preferences and browsing habits—is crucial for making data-driven decisions to optimize acquisition strategies or improve subscription retention. Understanding these behavioral differences between segments can help identify key attributes that inform decisions about optimizing Composer experiences or determining which content to lock or keep accessible to a broader audience.
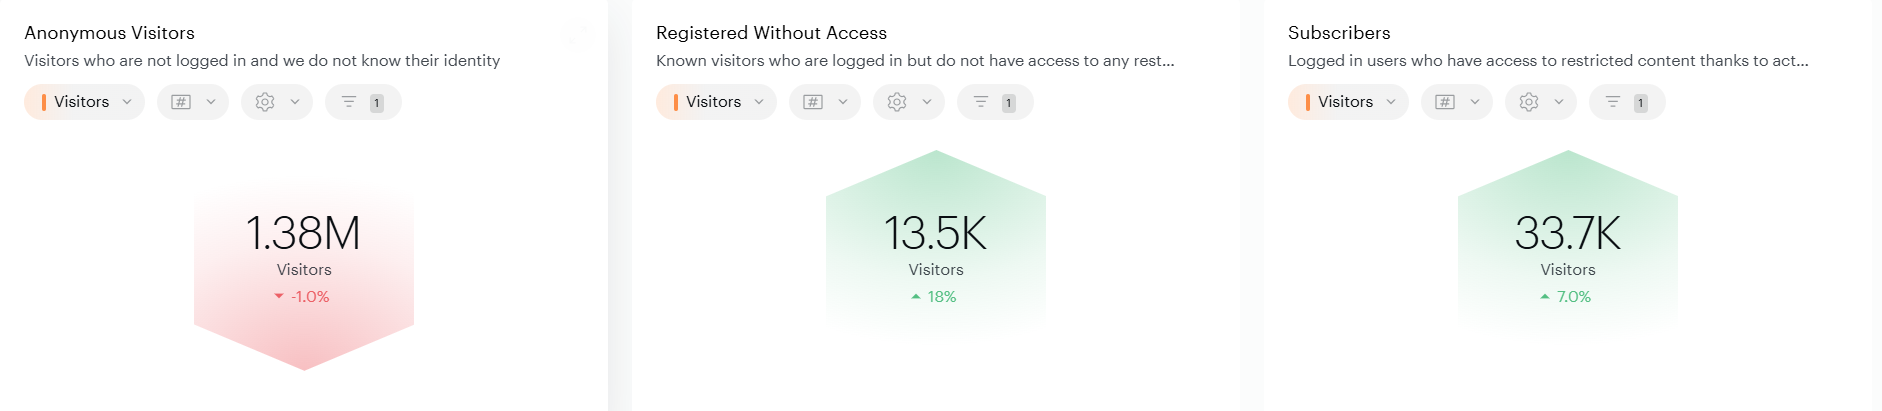
The segments used on the Audience page of the Editorial Performance Board are as follows:
-
Anonymous Visitors: Represents any visitor browsing the website who is either logged out or not registered.
-
Registered Without Access: Identifies logged-in users who do not have access to locked content.
-
Subscribers: Represents users with access to locked content through a purchased subscription.
These segments can be adjusted using the filter function on each chart tile. For example, if you want to compare the behavior of Site Licensing Subscribers, you can do so by selecting that segment in the tile filter instead of one of the segments mentioned above.
Traffic KPIs
To analyze the volume of traffic or engagement statistics for each segment, refer to the initial KPI charts. You can adjust the chart metrics by clicking on the “Visitor” metric.
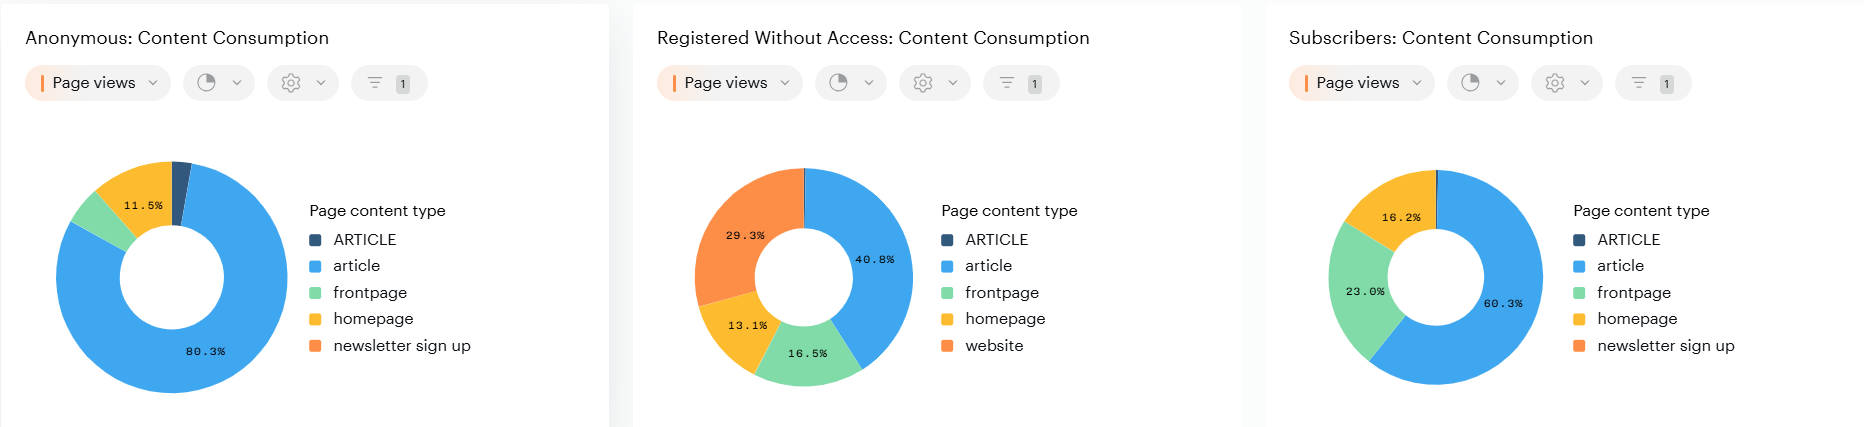
Traffic by content type
The breakdown of browsing patterns by content type for each audience segment helps identify the level of internal browsing circulation, particularly between the homepage, articles, and front page. If you notice a significant portion of “N/A” values, we recommend reviewing the SDK implementation, specifically the “Content type” field.
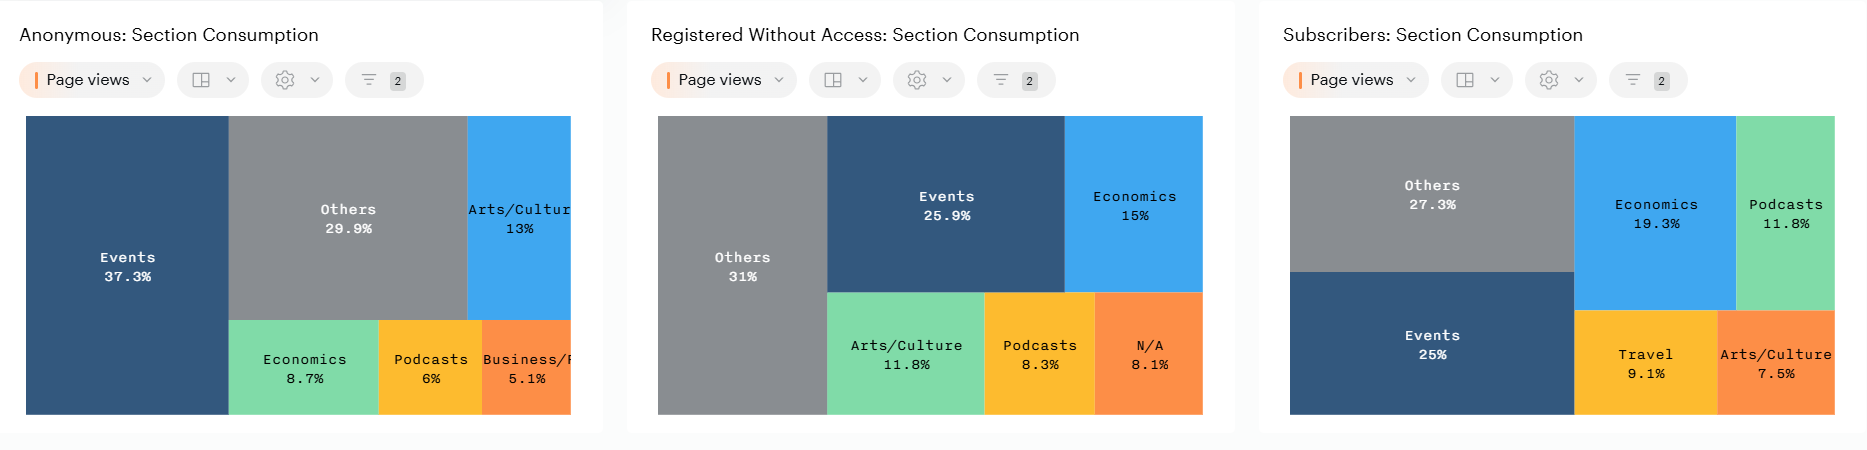
Traffic by content section
To identify which sections generate the most interest among the Anonymous audience or contribute to increased retention for Subscribers, refer to the next set of charts. To view the full list of all sections, expand the tile.
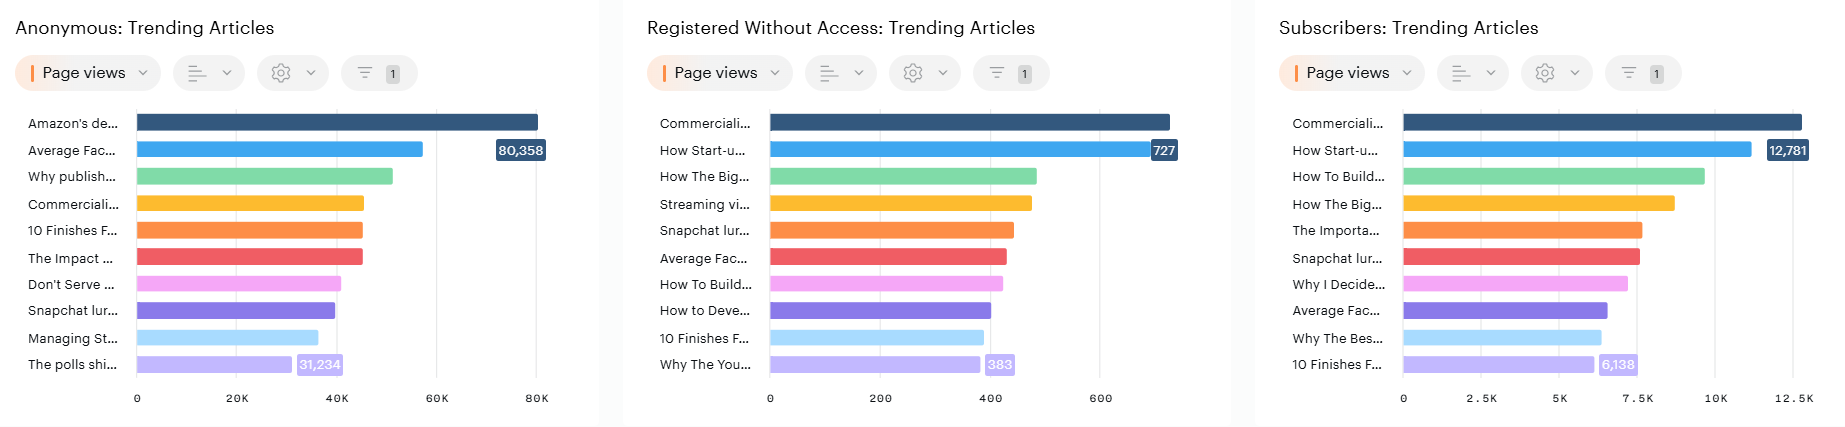
Trending Articles
To discover which articles are effectively acquiring new anonymous audiences, increasing engagement among known audiences, or performing well across all audience segments, refer to the next set of charts.
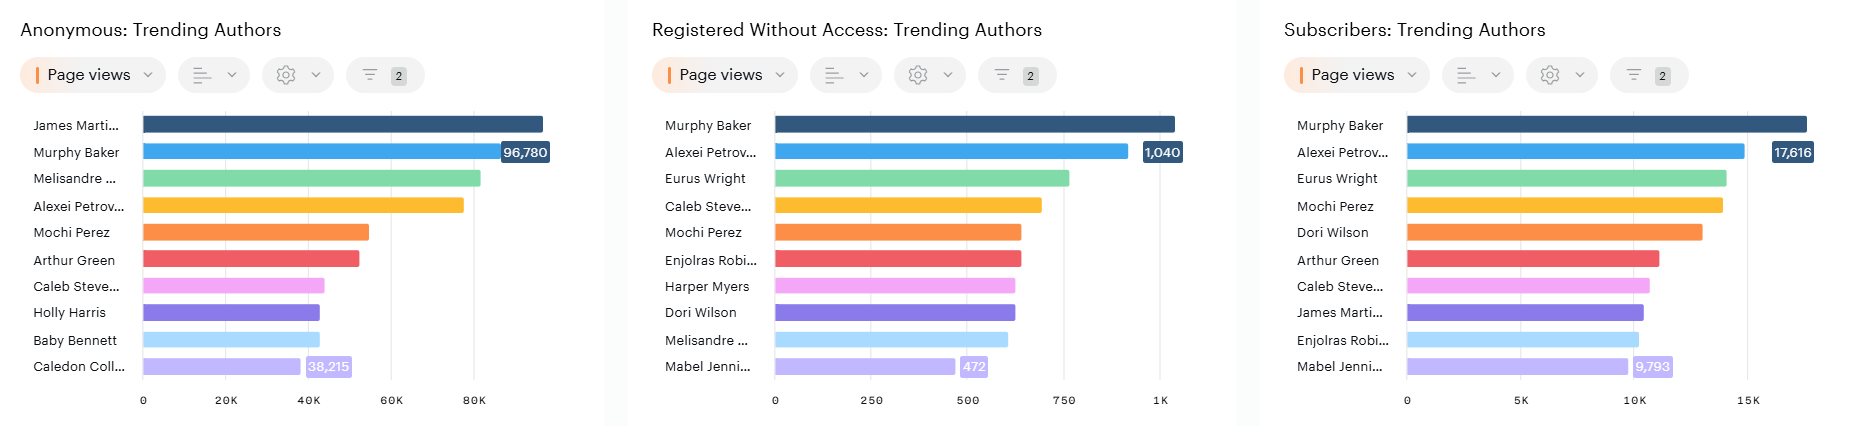
Trending Authors
To analyze author preferences across different audience segments, refer to the next set of charts. These charts help identify which authors drive engagement, attract new audiences, or contribute to retention. By exploring the data, you can understand how content from specific authors resonates with each segment.
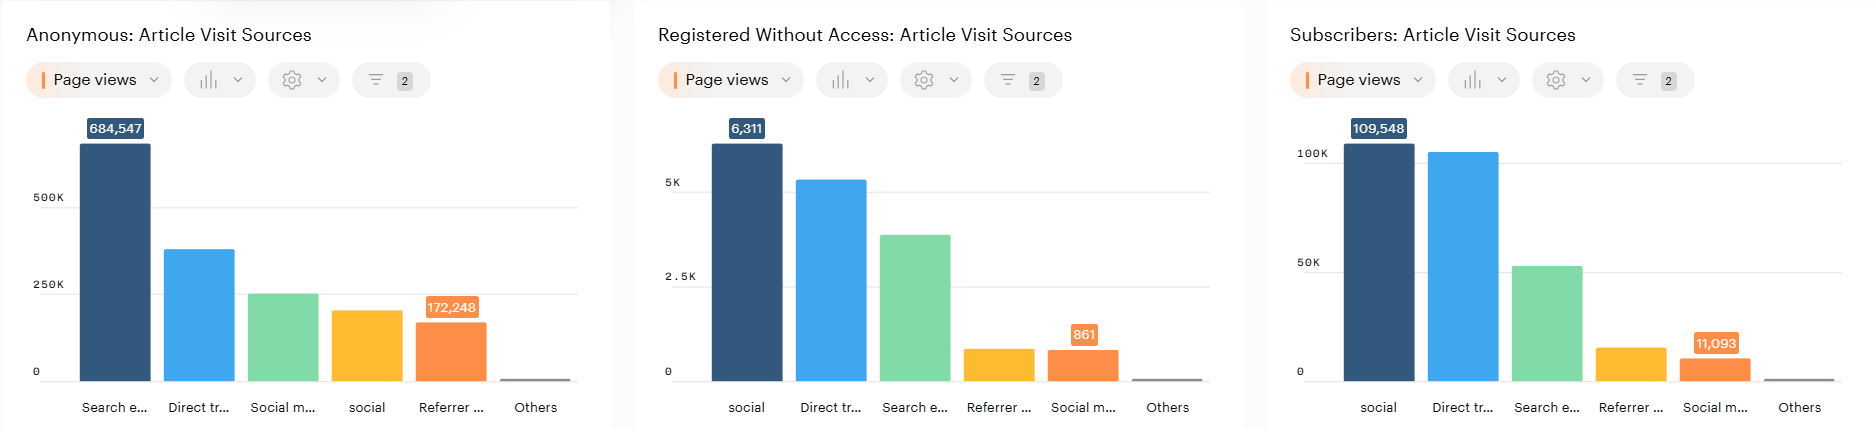
Article Visit Sources
To learn how the audience navigates to articles, see the next set of charts. The sources represent the origin of visits that resulted in an article pageview. This set of charts helps evaluate the effectiveness of your communication with the audience across multiple channels, such as social media and email, as well as the overall performance of your SEO strategy.
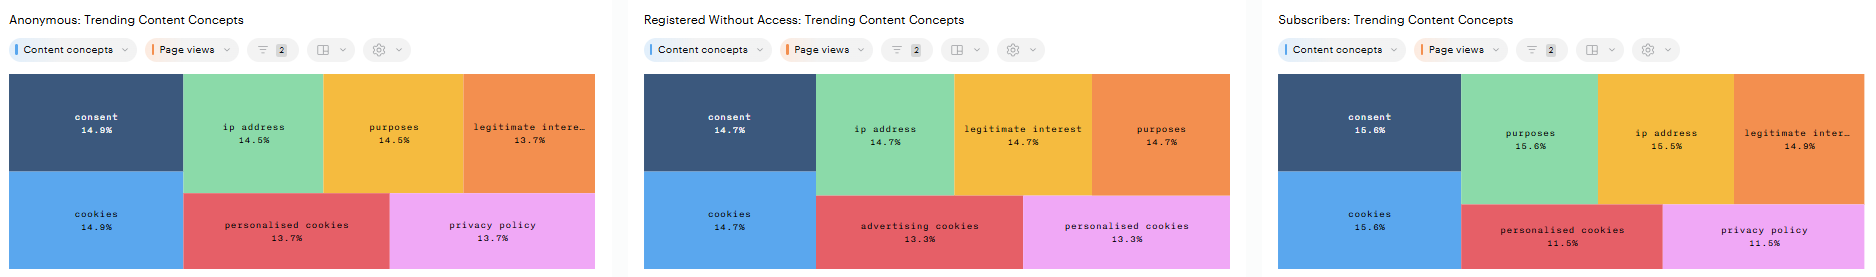
Trending Content Concepts
These charts help you understand which types of content — represented by content concepts — are preferred by your segments. Concepts refer to abstract ideas or general notions that convey meaning beyond specific entities or individuals. They encapsulate broader themes, categories, or topics that help in understanding the subject matter of the text. Concepts often represent relationships, processes, or ideologies rather than tangible, named entities.
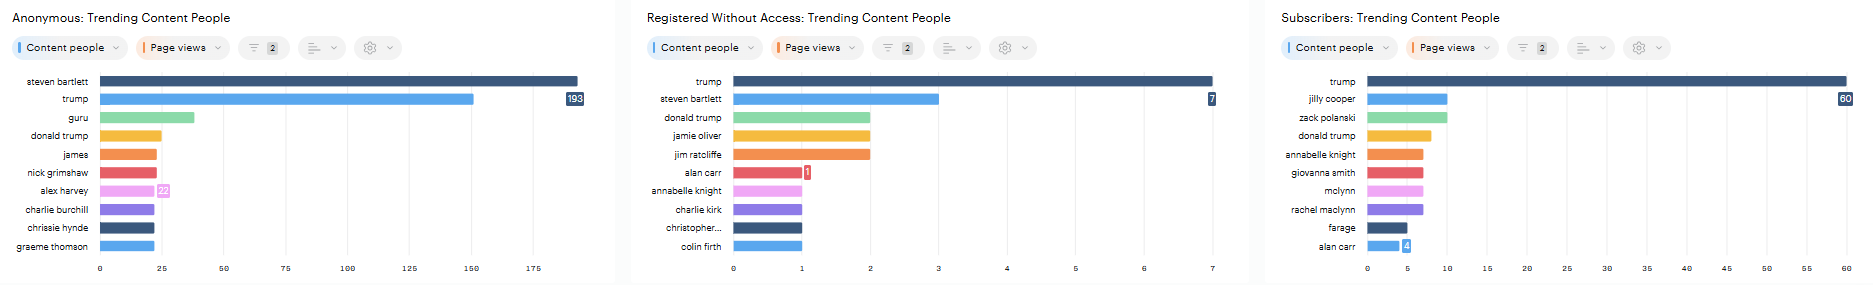
Trending Content People
To learn about which types of content — represented by content people — your segments prefer, use these charts. Content people represent celebrities or personalities mentioned in an article. They capture references to well-known individuals, helping you identify which public figures or personalities resonate most with your audience.
Articles
If you want to understand the value of the content you produce in the context of subscription acquisition and identify which editorial pieces contribute the most to both total and relative subscription growth, refer to the Article page.
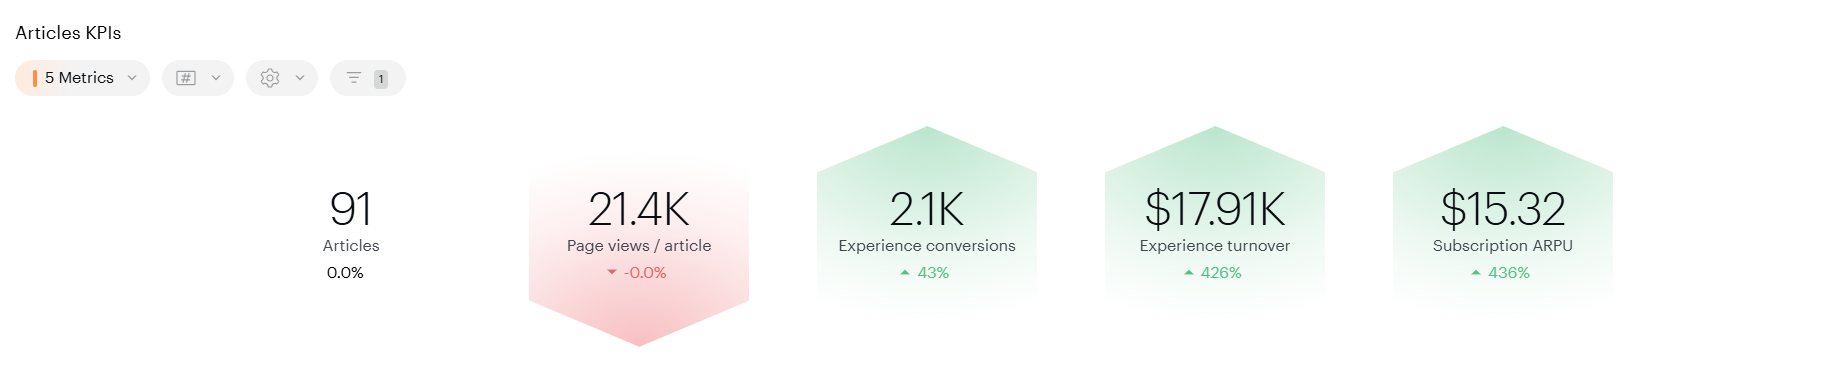
Article KPIs
The set of KPIs is designed to provide valuable insights into how article content is being consumed, as well as its total and relative revenue value.
-
Articles Metric: Represents the number of articles read within the analyzed time period, using a distinct count of article names.
-
Page Views per Article: Reflects the relative value of page views per article.
-
Experience Conversions: Describes the total number of any conversion type acquired through Composer.
-
Experience Turnover: Represents the total amount associated with experience conversion events paid by visitors.
-
Subscription ARPU: Indicates the average new subscription revenue per 1,000 visitors to the website.
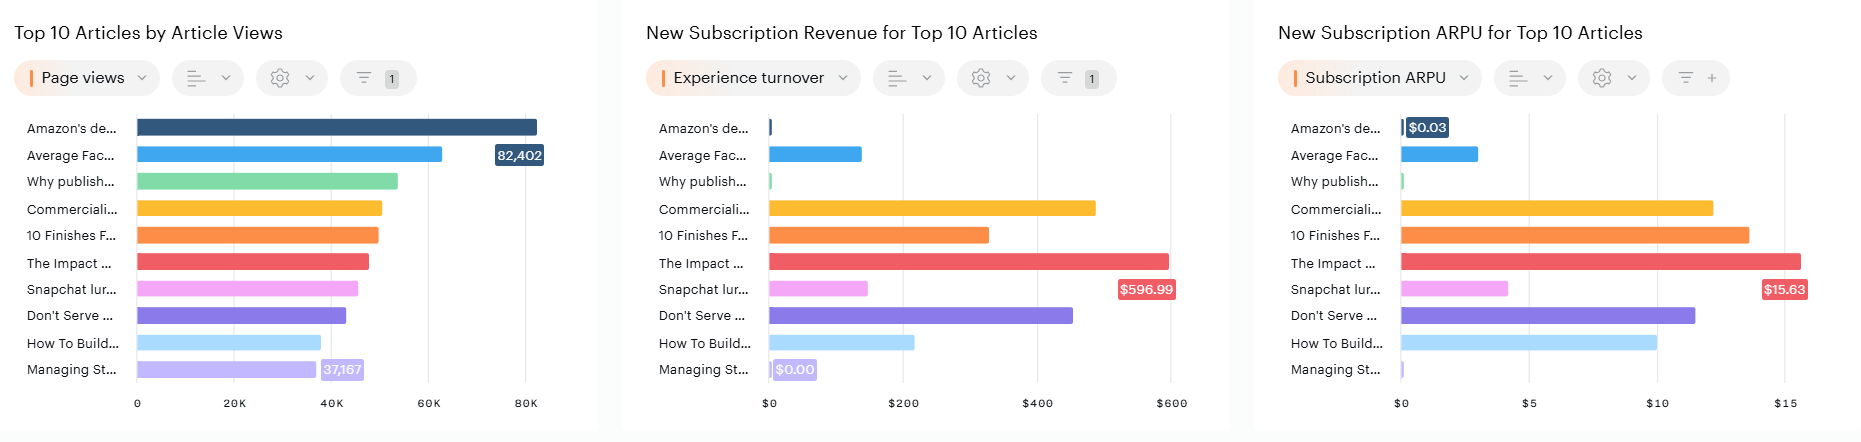
Top 10 Articles
To understand the relationship between traffic volumes and new subscription revenues in relative terms, and to identify articles with the highest relative value in the context of subscriptions, refer to these charts.
The property “Article” used in these charts represents the last article viewed before the conversion event. This means that even if you attribute conversions to a landing page, these charts allow you to analyze the true content source of the conversion event. For more details about the “Content that Converts” mechanism, refer to our documentation.
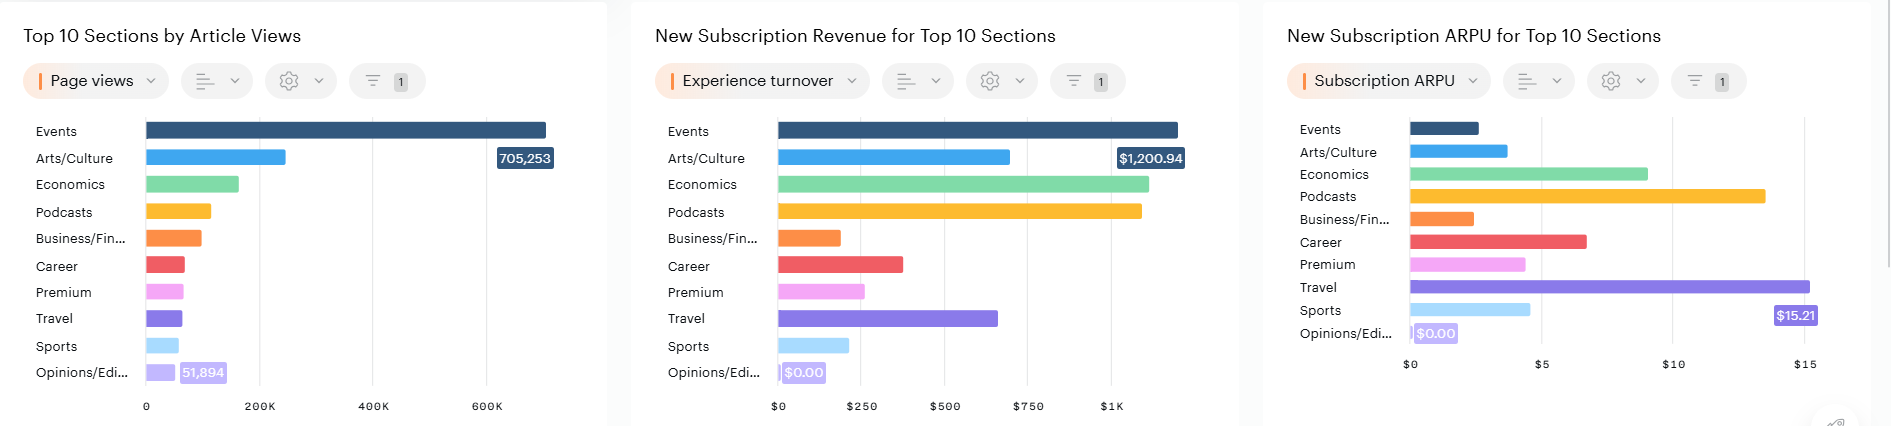
Top 10 Sections
Use these charts to gain insights into the total and relative value of each section in the context of subscriber acquisition. The Subscription ARPU metric helps identify sections that contribute not only the highest total traffic or new subscription revenues but also the highest relative value.
For example, while the “Travel” section may not rank at the top for Page views or Experience turnover, it has the highest Subscription ARPU. This suggests that focusing more on the monetization of “Travel” articles could improve subscriber acquisition.
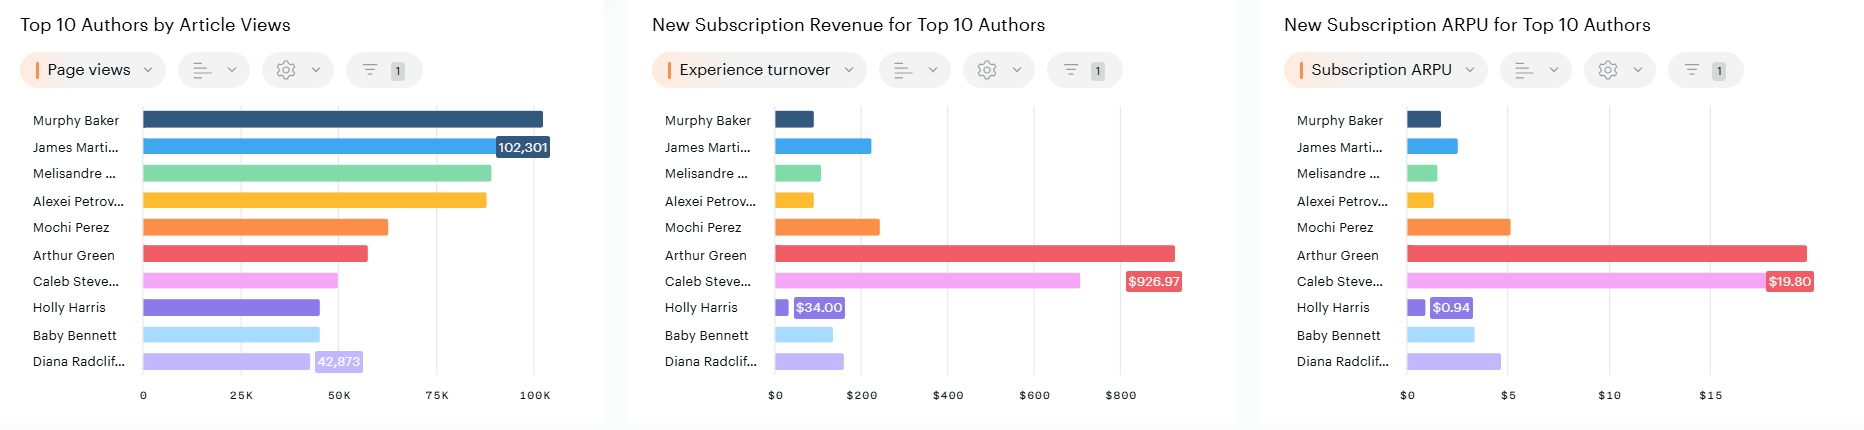
Top 10 Authors
To evaluate an article author’s performance in terms of traffic and new subscription revenue, refer to the following charts.
Content profiles
If you have a licensed Piano Audience account, we offer additional insights into the editorial impact on subscription acquisition. These insights are based on data processed using a powerful crawler, our in-house NLP algorithm, and a self-hosted LLM. More information about Content Profiles can be found on this dedicated page. If you do not have licenced Piano Audience but you want to learn more about the product, please contact you account manager.
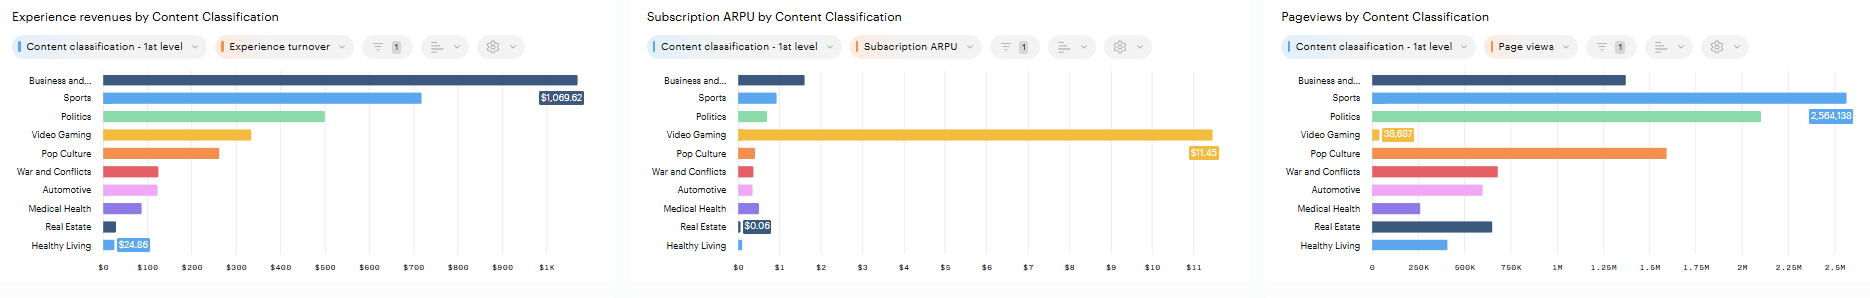
Content Classification
To evaluate an article’s performance in the context of content classification, in terms of traffic and new subscription revenue, refer to the following charts. Content Classification is topic of the article's content, according to the classification proposed by the IAB (here).
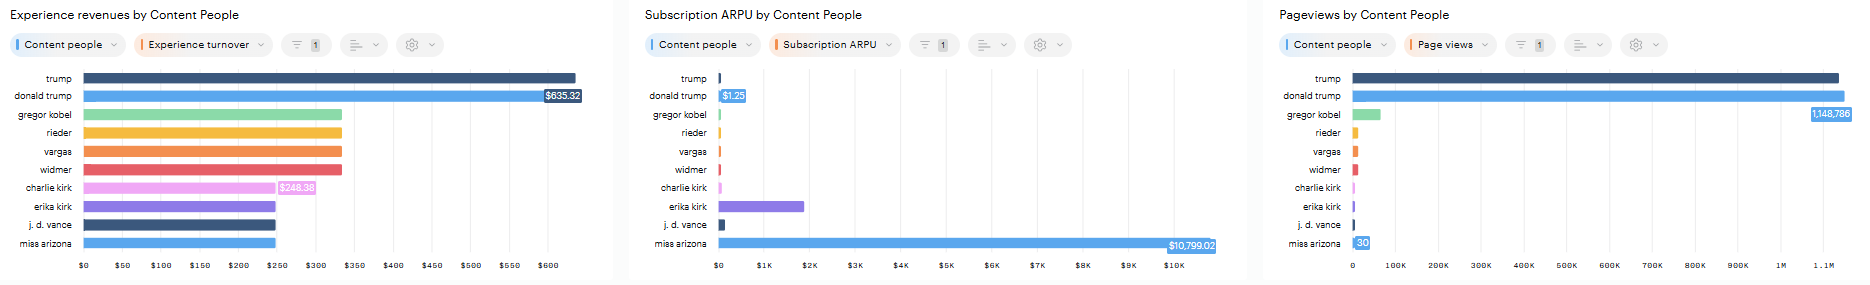
Content People
Use these charts to learn about which types of content — represented by content people — perform in terms of traffic and new subscription revenue. Content people represent celebrities or personalities mentioned in an article. They capture references to well-known individuals, helping you identify which public figures or personalities resonate most with your audience.
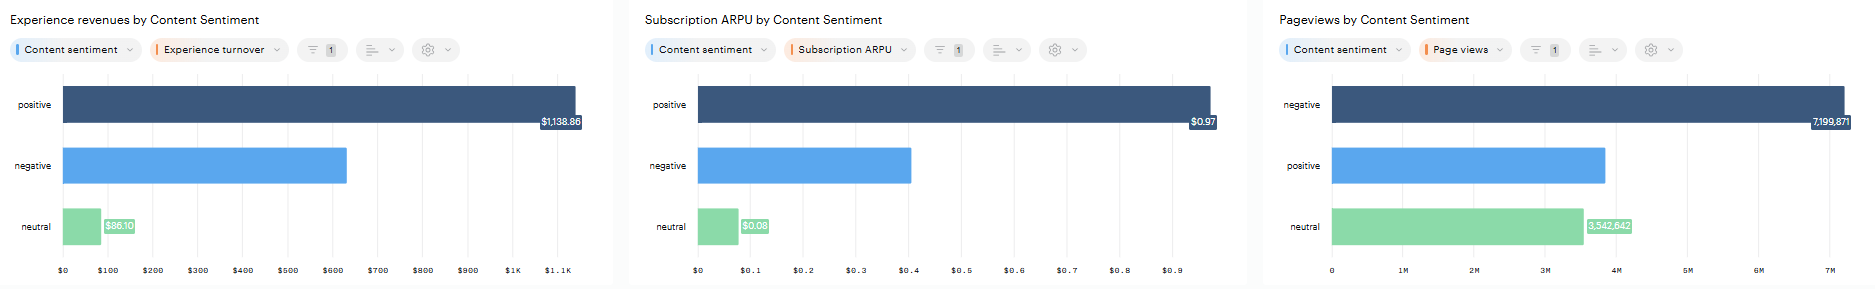
Content Sentiment
Analyze which types of content sentiment perform in terms of traffic and new subscription revenue. Content sentiment analyzes the overall emotional tone of your articles, helping you understand how sentiment impacts content performance.
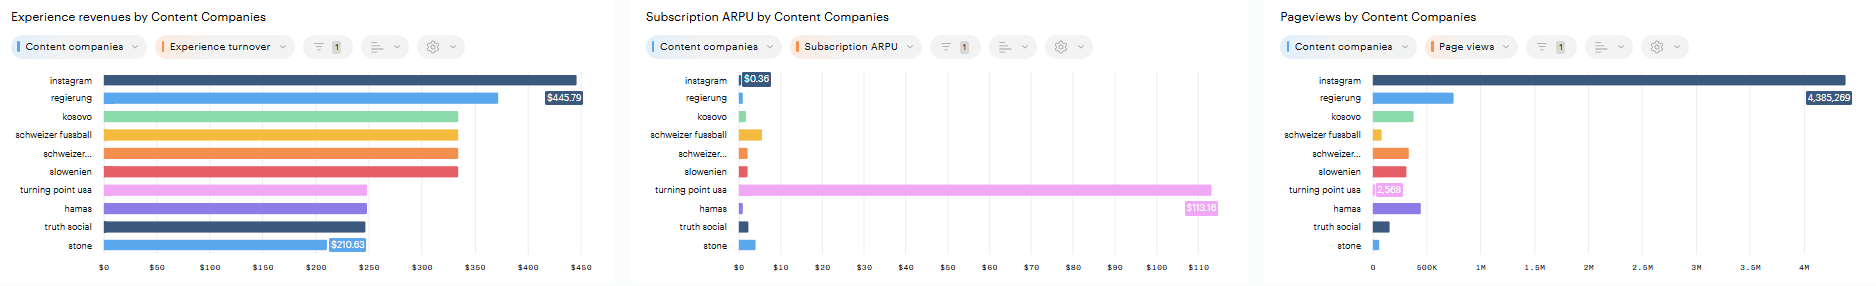
Content Companies
Understand which companies mentioned in the content perform in terms of traffic and new subscription revenue. Content companies are organizations (companies, political parties, institutions, clubs, ...) mentioned in an article such Apple, Spotify, Democrats, Manchester United…
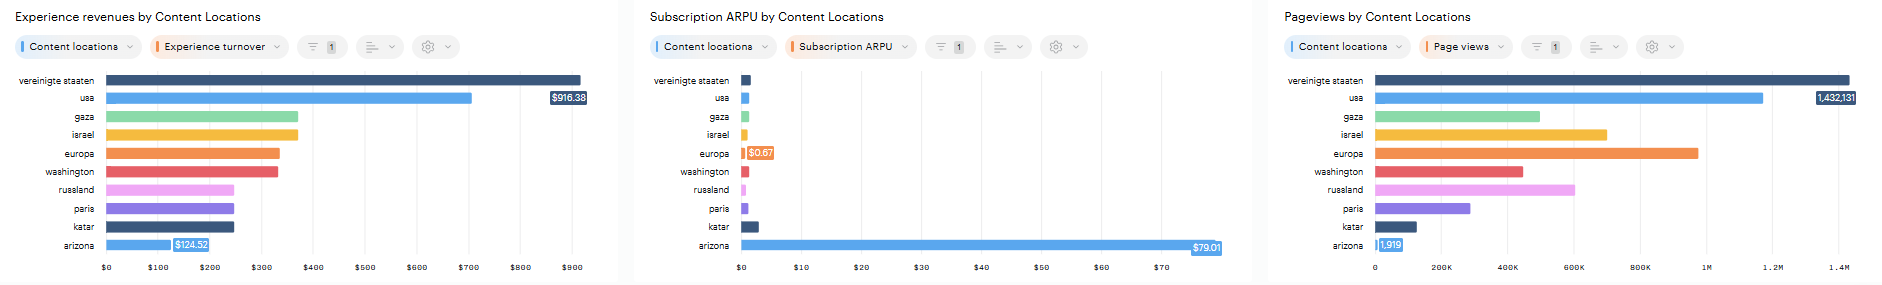
Content Locations
Learn about which locations mentioned in the content perform in terms of traffic and new subscription revenue. Content locations are places, locations, geographical areas mentioned in an article such as France, Germany, Paris, Texas, ...