
Data Query settings
Set a relative cohort
When you need to segment on your visitors, you have to set 2 periods:
The analysed period
The cohort period
With this in mind, you can understand how your December buyers (cohort period) behaved in January (analysed period).
Fixed Cohort
You define a period with a start date and a end date. This is useful when you need for instance to report on your new buyers acquired during an acquisition campaign and during the Summer Sales. This period doesn't change.
Relative Cohort
The relative cohort has to be used when your analysed period and your cohort period are linked, e.g. to report on the retention. When you choose a relative cohort, it automatically matches with the reported period.
Let's take the following example, with 4 analysis periods:
The 25th of June 2018
From the 25th of June to the 3rd of July
June 2018
Week 26 2018
...on which we are applying 6 relative cohort periods:
Previous month (M -0): month of the first day of the analysed period
Previous month (M -1): month before the first day of the analysed period
Previous week (W -0): full week (Monday to Sunday) of the first day of the analysed period
Previous week (W -1): full week (Monday to sunday) before the first day of the analysed period
Previous day (D -0): first day of the analysed period (not available of the analysed period is "Today")
Previous day (D -1): day before the first day of the analysed period
| Analysis Periods | |||
The 25th of June 2018 | From the 25th of June to the 3rd of July | June 2018 | Week 26 2018 | |
Cohort Periods | Cohort Definition | |||
M -0 | June 2018 | June 2018 | June 2018 | June 2018 |
M -1 | May 2018 | May 2018 | May 2018 | May 2018 |
W -0 | Week 26 2018 | Week 26 2018 | Week 22 2018 | Week 26 2018 |
W -1 | Week 25 2018 | Week 25 2018 | Week 21 2018 | Week 25 2018 |
D -0 | 25th of June 2018 | 25th of June 2018 | 1st of June 2018 | 25th of June 2018 |
D -1 | 24th of June 2018 | 24th of June 2018 | 31st of May 2018 | 24th of June 2018 |
When using cohorts on current periods (M -0, W -0 and D -0), if the analysed period is not over (current month, current weekd, etc.), the cohort periods will end on the day before the analysed period.
E.g. let's imagine today is the 17th of December 2018 and that the analysed period is week 50 2018 (10th to 16th 2018):
Cohort Periods | Cohort Definition |
M -0 | December 2018 (from the 1st to the 16th) |
W -0 | Week 50 2018 |
D -0 | 9th of December 2018 |
In the "Segments Manager"
In the Segments Manager, pick the "Visitors" scope (or "Identified Visitors"). The "period" parameter shows up and then you can choose either a fixed cohort period or a relative cohort period:
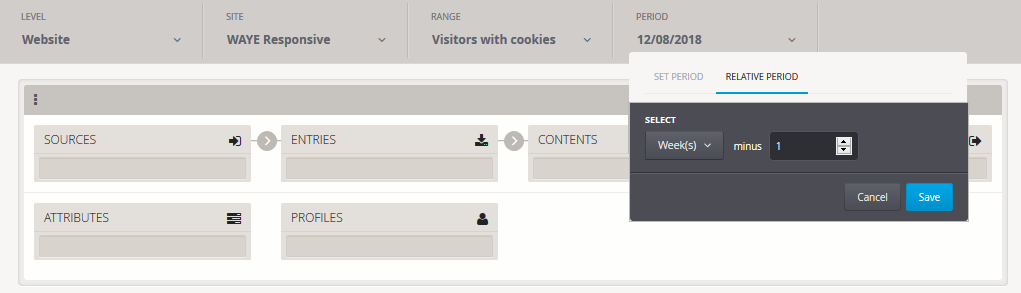
This relative cohort period will always be related to the analysis period and not to the day you query the data.
Totals, reference, context
"Total" row
The "Display sums on results pages" option reflects the sum of all elements displayed from your paginated, filtered dataset.
If you use filters and/or specify a limited number of rows in your dataset, the "'Total' rows" will take these actions into account. For example, in the case of a Country/Visits dataset, if you use a filter on the Country dimension in order to limit results to France and Germany, the "'Total' rows" will be the sum of visits coming only from France and Germany.
Tip
You can't combine the evolution mode with the "'Total' rows" option.

The "Sum of all elements" option reflects the sum of all elements in your dataset, not taking into account any filters or pagination.
Tip
If your dataset contains more than 45,000 rows, the sum of your data will reflect your entire dataset (45,000 rows), not only the first 10,000 rows.

Reference
The option "Site reference" reflects the total of metrics of the reference site. This option enables you to identify the proportion of data contained in your call with regards to the total of metrics at the site level.

Tip
No matter the filters and segments applied to your query, the "Reference" total remains unchanged.
Context
The option "Display context" reflects the global business-oriented information of each item of the analysis. For example: the site selected, the data format (date, integer, decimal, etc.).
Evolution
The option "Activate the evolution mode" lets you study the evolution of metrics over time. To use this option, you must indicate the desired granularity of your data (day, week, month).