How do I change the granularity when exporting graphs from Dashboards?
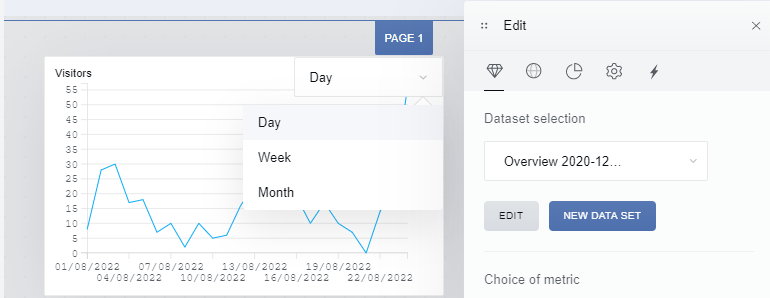
When you export a Dashboard, the time scale used on each graph is the one indicated in the settings for it. That means changing from Day to Week while visualizing it for example would have no effect on the export.
You can modify this from the edition mode Open your dashboard, click to modify an item, and you will find a drop-down list in the graph itself where you can change the default time scale.

Once you have made the change, save the dashboard and proceed to export it. The graphs will appear as they were configured.
