
Overview
The dashboard-to-board converter is a powerful migration tool designed to help administrators seamlessly transition from legacy Dashboards to the modern Workspaces interface. This automated conversion tool streamlines the migration process while preserving your existing analytics setup, sharing configurations, and data visualizations.
By converting your Dashboards to Boards, you can take advantage of enhanced performance, improved user experience, and access to the latest features available in the Board interface, all while maintaining continuity in your analytics workflow.
Access requirements
This feature is exclusively available to administrators.
How it works
When logged in to the Library as an administrator, you now have access to a new "Convert to a Board" button located in the "…" menu of any Dashboard.
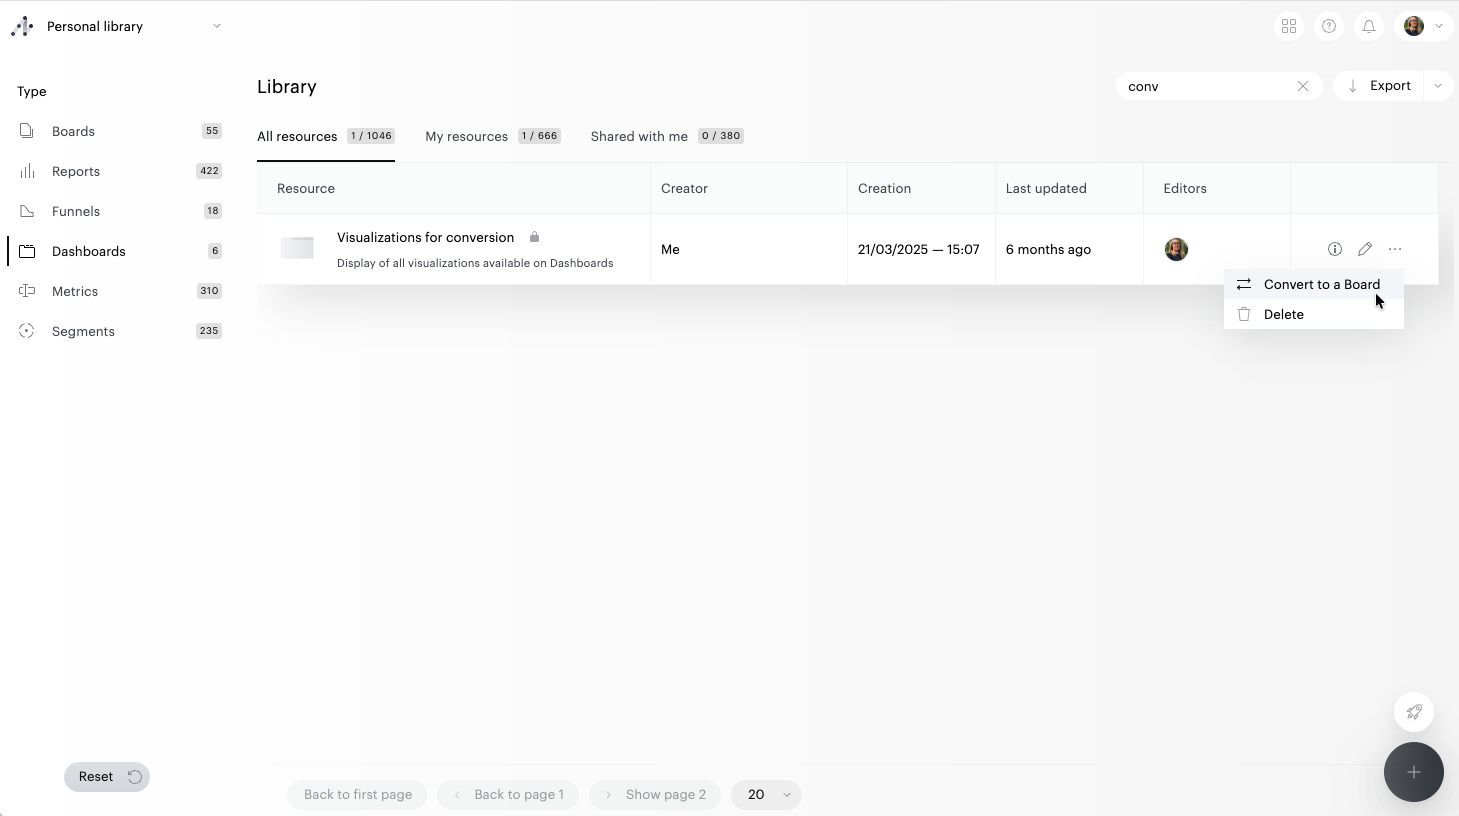
Clicking this button displays an information popup with details about the conversion process.
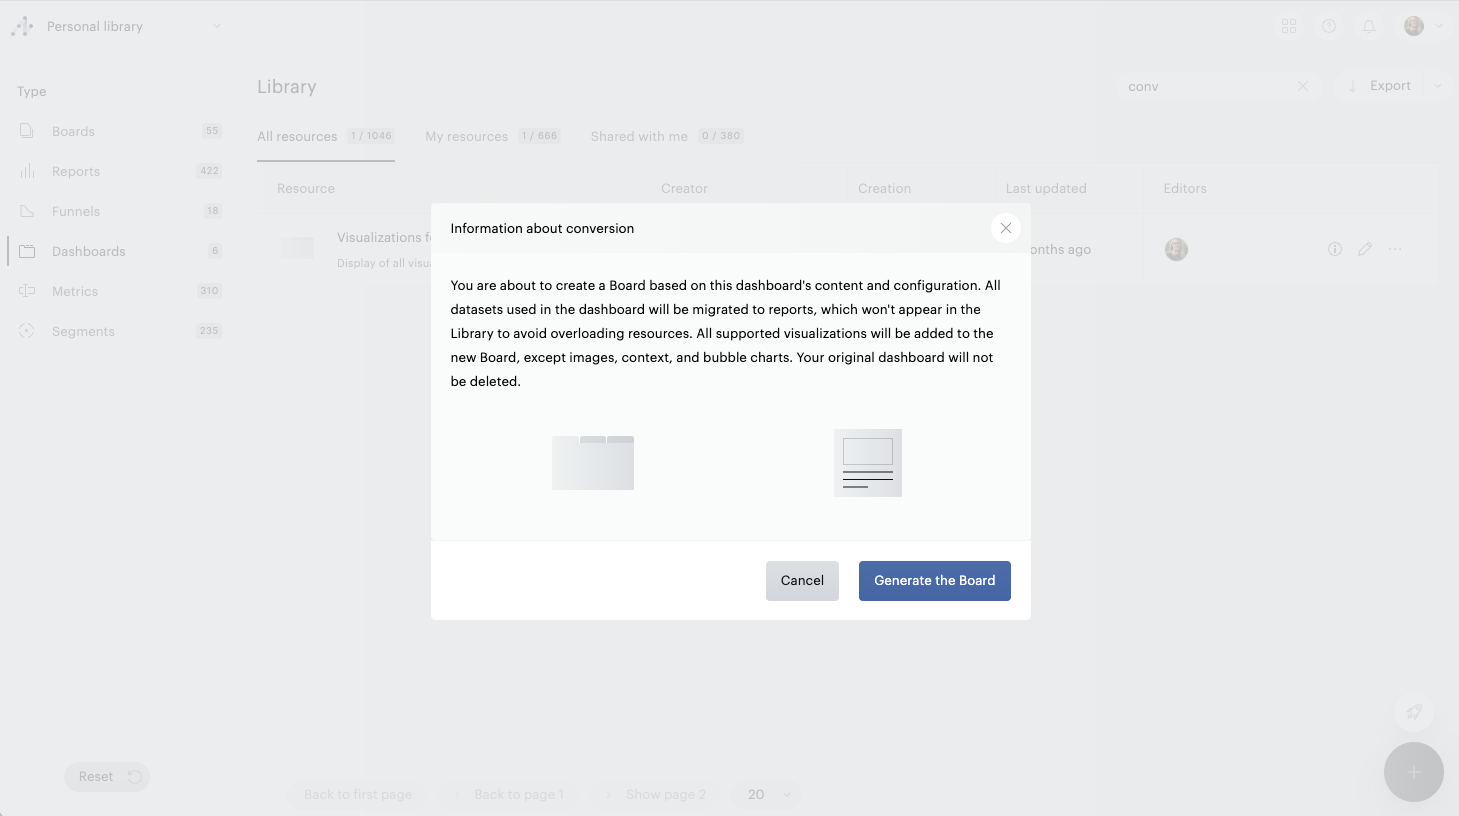
When you click "Generate the Board", a new Board is created containing all convertible elements from your Dashboard. Once the conversion is complete, you can click the "Open [board name]" button to view the results.
Important: The original dashboard is not deleted during conversion - we simply create a copy. You will need to manually delete the original dashboard if you no longer want users in your organization to access it.
What gets converted
Reports
All reports are converted but will not appear in the Library to avoid unnecessary clutter. You can still use the "Open in Data Query" feature from fullscreen tiles to edit reports. If you save changes to a report, it will then appear in the Library.
Visualizations
During Dashboard conversion, some visualizations may not be converted exactly as they appear, or may not be converted at all.
Elements that cannot be converted
The following elements will not be recreated in the board:
-
Image tiles
-
Country visualizations
-
Context elements
-
Bubble charts
-
Tile overlapping (z-index)
Elements converted with modifications
The following elements will be recreated in the board with slight changes:
-
Half pie chart → becomes a full pie chart
-
Multi-metric line chart → becomes a "single axis" multi-metric line chart
-
Sparkline → becomes a standard line chart
-
Matrix → becomes a table
-
Multi-metric heatmap → becomes a single-metric heatmap
-
Tag cloud → becomes a table
-
Text tile → formatting is removed
All other visualizations are migrated with their existing options (number of items, min/max values, averages, etc.).
Sharing settings
All sharing settings from the original Dashboard are preserved in the converted Board.