
It is not possible to know the actual number of optout visits or visitors, in accordance with visitors’ wishes not to be tracked (GDPR compliance). Visitors who explicitly refuse tracking (Visitor mode = optout) are not tracked, so visit- and visitor-level data is not collected.
However, it is possible to estimate optout volumes based on the average number of events per visit or visitor when visitors are not optout.
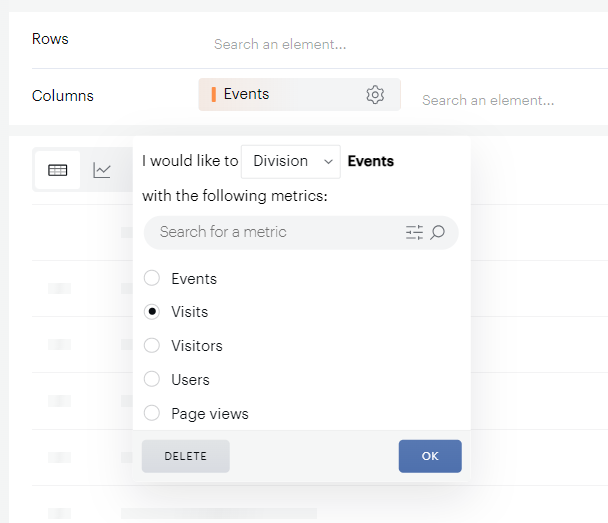
Step 1: Calculate the average number of events per visit (or visitor) for non-optout traffic
To find out this figure, create a custom metric on the fly from Data Query that divides the number of events by the number of visits or visitors.
To do this, add the Events metric to your analysis, and click on Create metric. Then choose Division and the metric of your choice (for example, Visits or Visitors) before confirming.
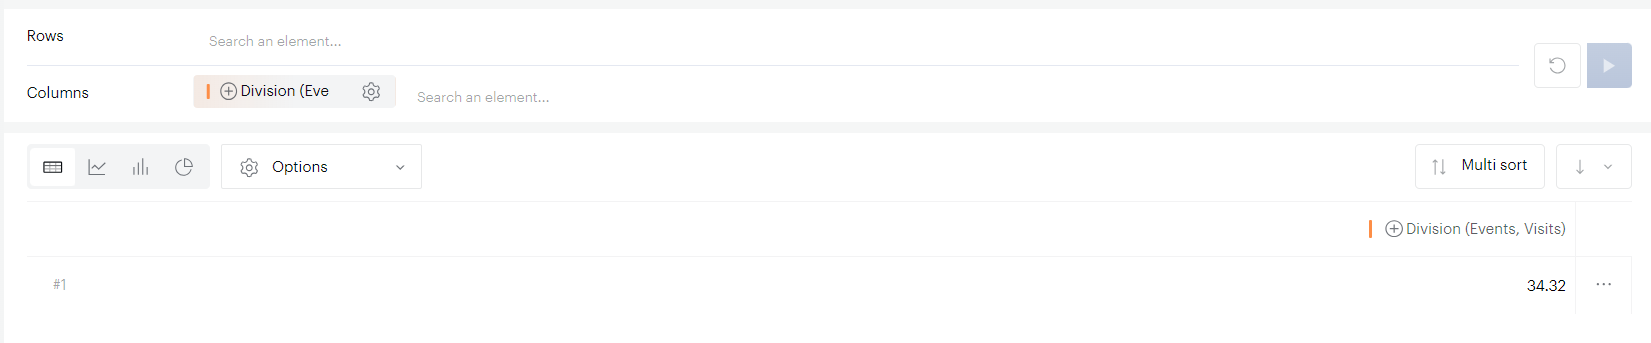
This gives you an average, which in our case is 34.32.
Step 2: Get the number of events generated in optout mode
Now that you know the average number of events per visit or visitor for the chosen period, you need to observe the number of optout events generated.
Create a new report with the Visitor mode property and the Events (all) metric, filtering your property on the optout value.
We can see that we have 538 events generated in optout mode.
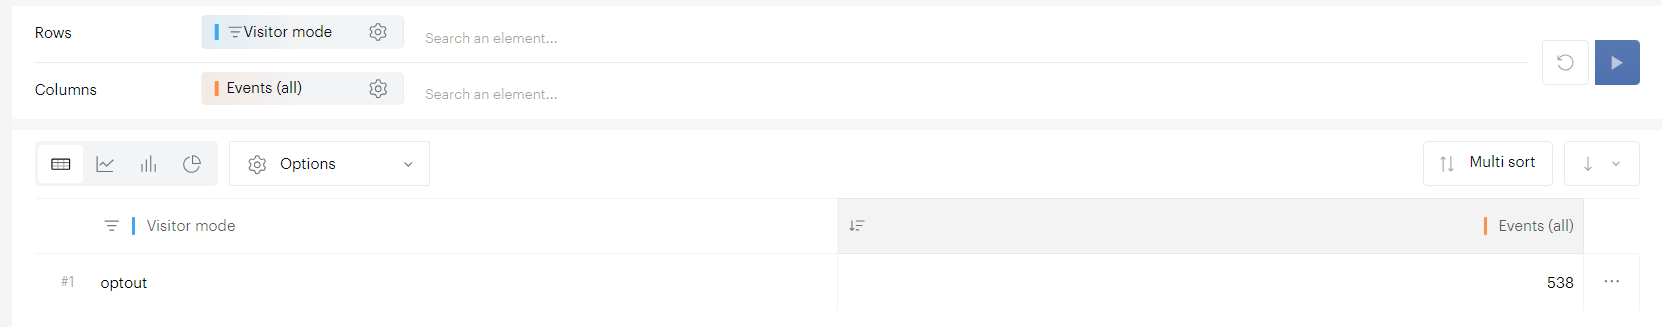
In Data Query analyses, events with Visitor mode = optout are automatically excluded to comply with privacy regulations. To see optout events, use the Events (all) metric, which includes all events (including those excluded from standard analyses).
Step 3: Estimate optout visits or visitors
Divide the optout event count by your previously obtained average:
538 / 34.32 = 15.6
So we know that we have an average of 15.6 optout visits for our analysis period.