Set up a dashboard
The Dashboards app will stop working at the end of June 2026
Dashboards will be replaced by Boards, available in Workspaces. Boards gives you all the features of Dashboards, with many improvements: AI-powered analysis, global filters, flexible exploration, and much more.
We recommend migrating to Boards now. You can automatically convert your existing Dashboards or create new Boards from scratch.
Workspace
The workspace can be broken down into four main areas:
Toolbar
The toolbar lets you apply actions to your entire dashboard: save the document, apply a theme, preview the final result, or delete the dashboard.
Context bar
From the context bar, you can select the sites, level 2 sites, and periods whose data will be displayed in your dashboard.
Sidebar
Using the sidebar, you can build the content of your dashboard: add a graph or a data set, and arrange your workspace as you'd like.
Workspace
Place your dashboard's data, graphs, and visual elements in the workspace.
Manage your sites
You may display data from separate sites in a single dashboard.
Using the context bar's drop-down menu, you can set up the list of sites you wish to use in your dashboard.
1/ Click on "Edit" in order to customise this list.
2/ Click on the selection field to display a list of sites to use, or search directly for a site to quickly access the one(s) you're seeking. You can delete a site from the list by clicking on the X next to the site name, or clear the list to start over.
You may also specify which site should be used by default when you open a dashboard.
Tip
By default, blank dashboards will only suggest your default site. If you wish to use other sites, you'll need to add them by modifying the list.
Manage periods
Just as you may choose the sites to use, you may also select different time periods for the data displayed in your dashboard -- either custom periods (enter your desired dates) or pre-set periods (today, yesterday, last 7 days, last 30 days, current month, last month,etc.).
Click on the calendar icon to use the period you defined as your default period when you open a dashboard.

Note
You can examine your data across any period of 12 months maximum.
Manage tabs
You may split the data you display across several tabs. This will help you organise your information into several levels. For example, you might give an overview on one tab, then focus on more specific areas on one or several other tabs.
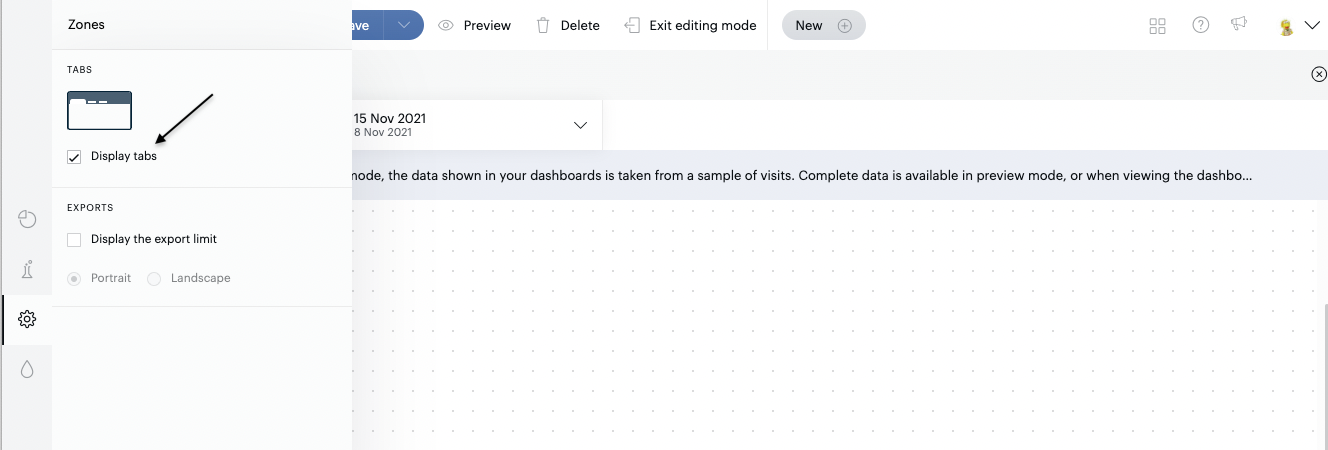
To add a "Tabs" area to your dashboard, simply go to the sidebar, click on the third tab to expand the "Zones" window, and enable the display of tabs:

To rename a tab, double-click on its name
To add a new tab, click the "+" icon to the right of the tab area
You may change the order of the tabs by clicking and dragging them left or right
Finally, you may delete or duplicate a tab. When you duplicate a tab, all boxes that exist on the tab to be duplicated will be copied over to the new tab:
Note
If you delete a tab, you will lose all elements on this tab. If the deleted tab is the last remaining tab in your dashboard, all content will remain in the workspace, but the tab will no longer exist.
Display the print area
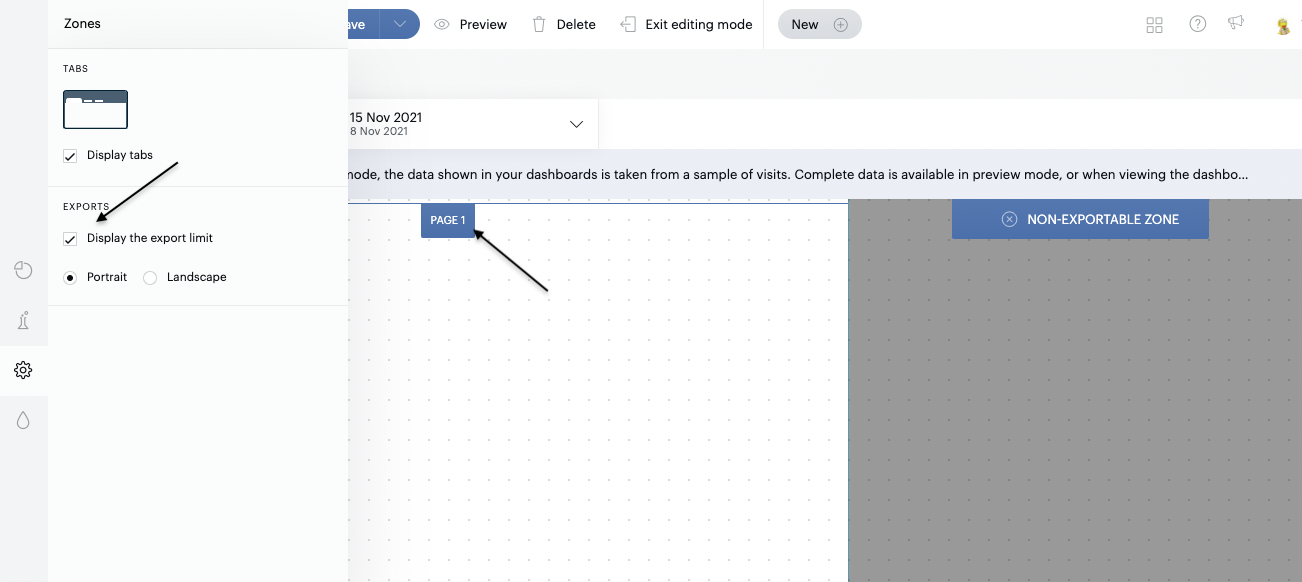
If you would like to export your dashboard, you may first display the print area on your workspace. This will enable you to arrange your elements in a way such that they won't be cut off when you generate an export.
This display option is available in the sidebar: simply go to the sidebar, click on the third tab to expand the "Zones" tab, then tick the box to enable display of the print area (export limit). Next, select your desired format (portrait or landscape).

Note
This action must be taken for each and every tab of the dashboard you wish to export.
