Introduction to Social Insights Boards
Introduction
Social Insights provides one standard reporting board to meet the analysis needs of your social publishing team. If you are also a Piano Analytics customer, as detailed below, a version of each board can be saved, manipulated and modified to suit your needs.
More information on how to use workspaces can be found here.
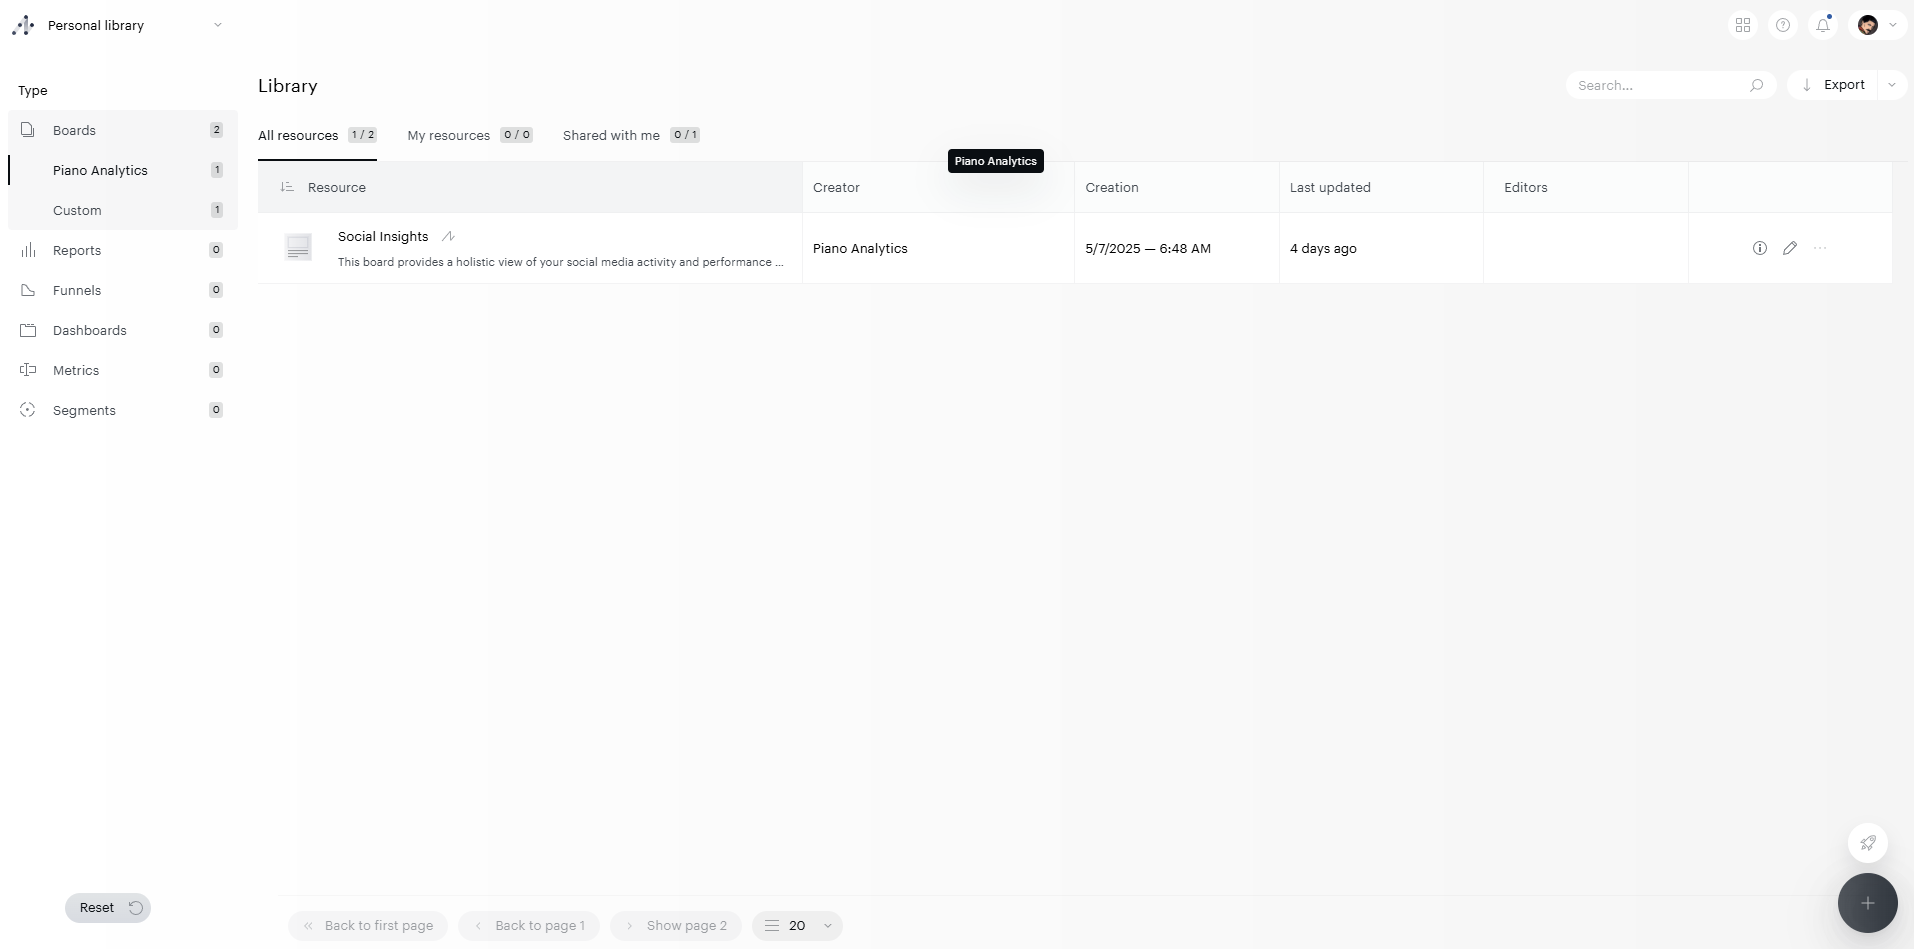
Location
The standard Social Insights board is available in your Piano Analytics library alongside all of your other Piano Analytics resources. All boards are located in Boards > Piano Analytics > All Resources section of your library.
Social Insights
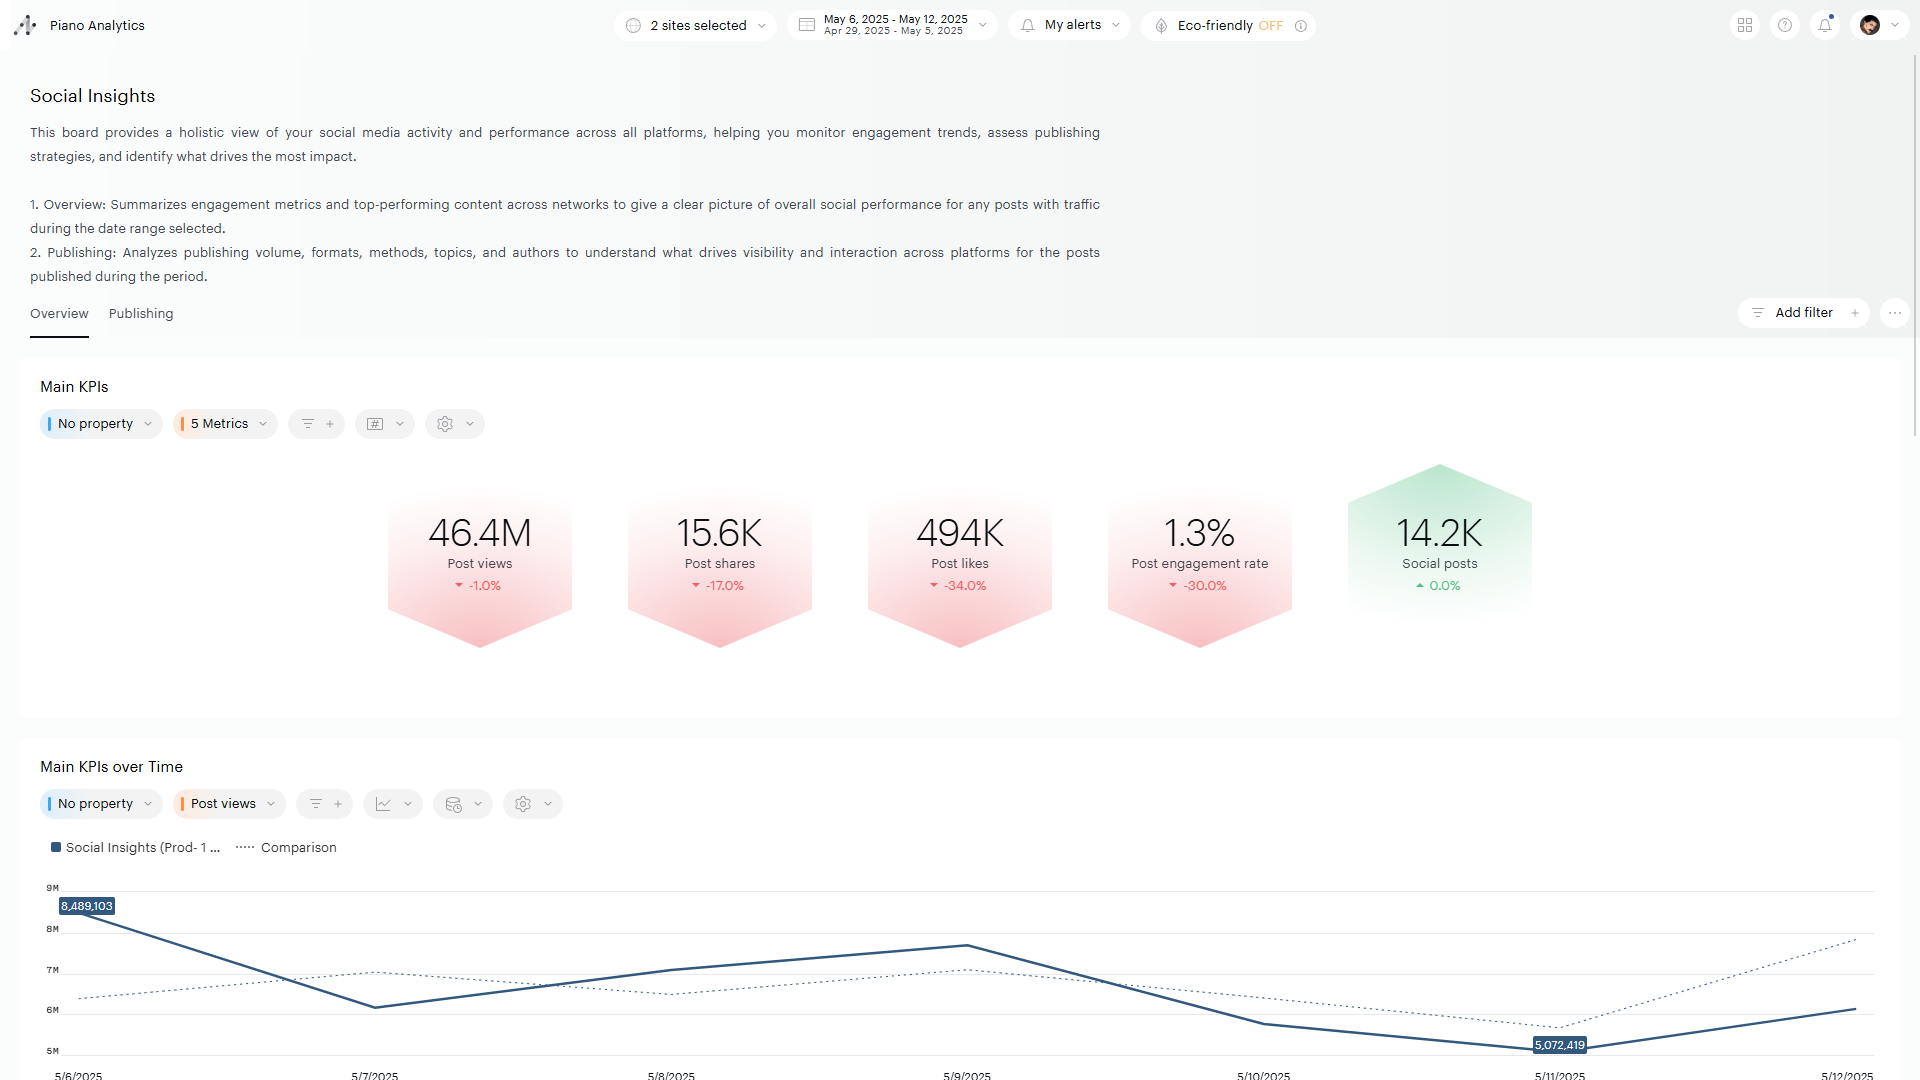
This board provides a complete overview of your social media activity across all platforms. It is divided into two sections — Overview and Publishing — to help teams track engagement metrics, evaluate publishing strategies, and identify top-performing content, authors, and networks. The goal is to offer actionable insights into what drives performance and how to optimize your social publishing tactics accordingly.
In its first version Social Insights only includes data about Threads. Subsequent releases will add data from other social networks supported by Amplifier but also new information like the number of clicks.
Overview tab
This section focuses on global performance and engagement trends across all social media channels. It provides aggregated metrics, top-level comparisons, and high-performing content identifiers. Each tile also shows a comparison to the previous period by default.
The overview tab contains the following reports :
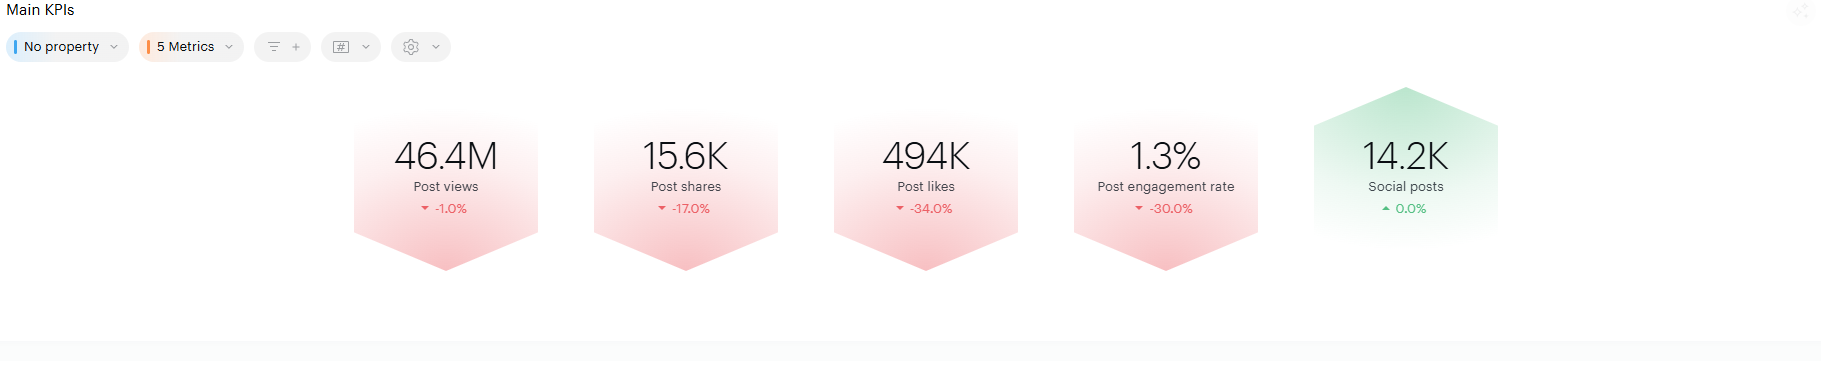
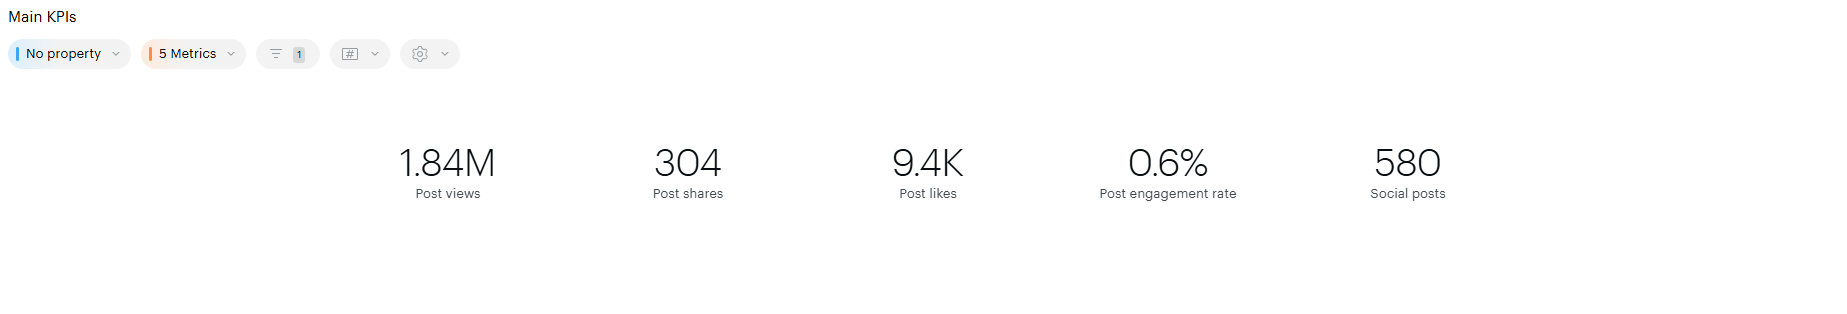
Main KPIs
A set of high-level KPIs summarizing total performance across all networks for the selected period. Each metric includes the delta (change) compared to the previous period to track progress. These metrics reflect overall views, engagement (shares, likes), volume (posts), and efficiency (engagement per post).
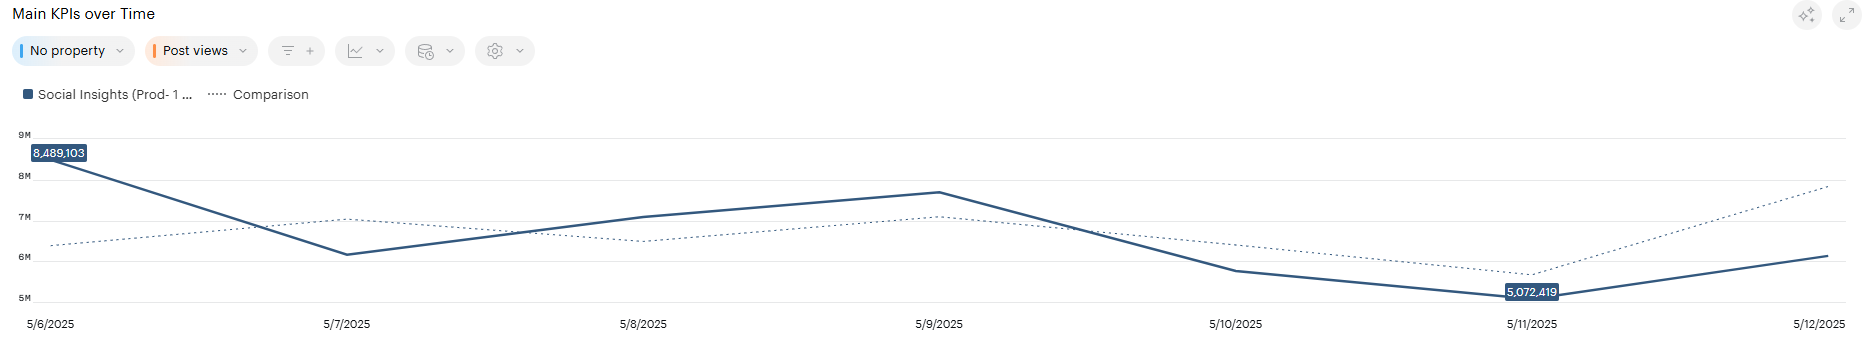
Main KPIs overtime
A time-based line chart that visualizes total views across all social networks. This chart helps identify overall trends and seasonal patterns and it’s useful for tracking the impact of major campaigns or events happening during the period.
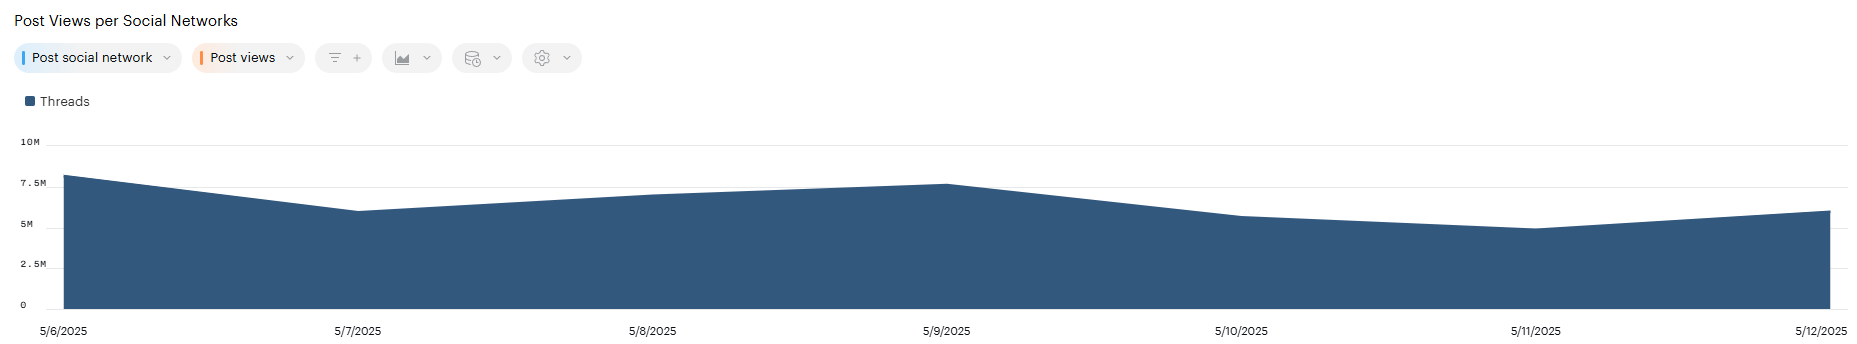
Post Views per Social Networks
An area chart that breaks down views per platform (e.g., Facebook, LinkedIn, X, etc.) over time. You can switch the displayed KPI to compare different metrics (e.g., clicks or posts) across networks and understand each platform's relative contribution to overall performance.
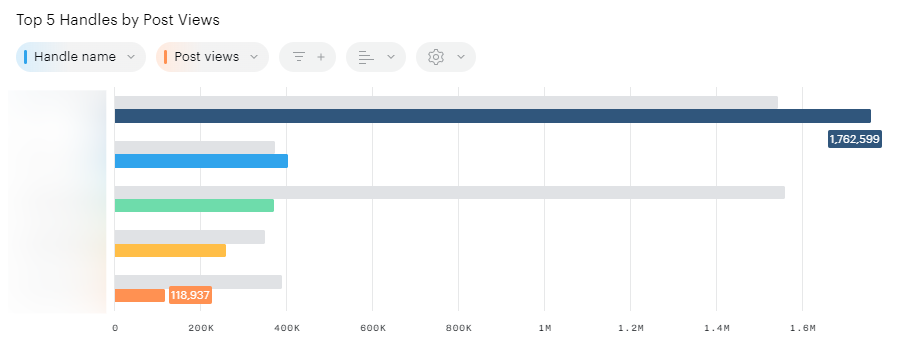
Top 5 Handles by Post Views
A ranking of the 5 handles (pages or accounts) that generated the most views during the selected period. This view highlights which social identities are performing best in terms of reach.
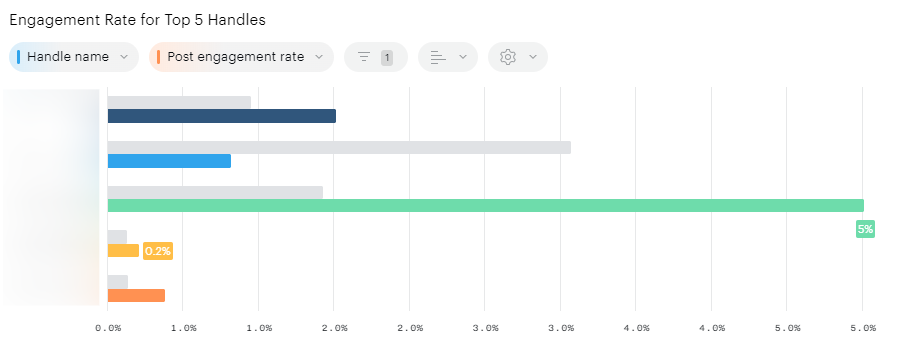
Engagement Rate for Top 5 Handles
For the top 5 handles on the previous tile, this tile displays the engagement rate so you can understand the relationship between views and engagement rate.
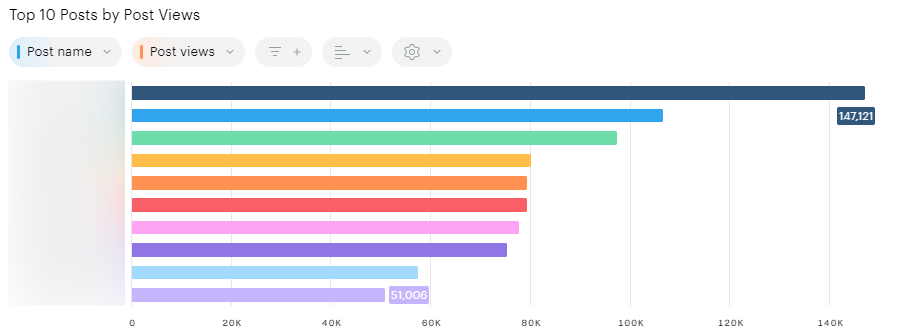
Top 10 Posts by Post views
A ranking of the 10 best-performing individual posts based on total views. This allows teams to identify which messages resonated most with audiences.
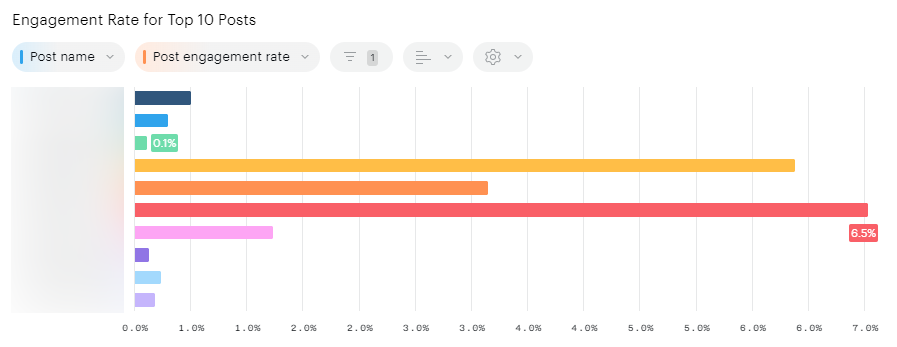
Engagement Rate for Top 10 Posts
For the top 10 posts on the previous tile, this tile shows engagement rate so you can understand the relationship between views and engagement rate.
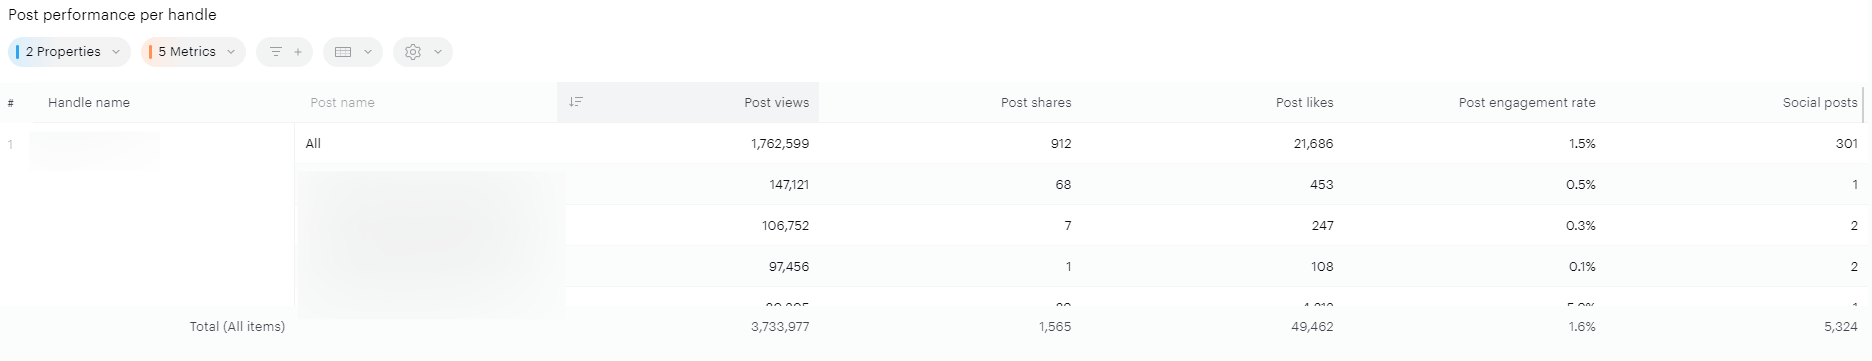
Post performance per handle
This chart displays the top 5 posts for each handle (you can click on “show more” to display additional posts), along with detailed performance metrics including shares, views, likes, engagement rate, and number of posts. It provides a granular view of what content performs best for each account, helping identify successful formats or messages at the handle level.
Publishing tab
This section explores your publishing behavior across networks — how much you post, what you post, how it's published, and who is publishing it — to identify patterns that influence performance.
The whole tab is filtered to show the posts published over the period selected in the calendar to better reflect your publishing behavior
The publishing tab contains the following reports :
Main KPIs
A set of core publishing metrics summarizing the performance of posts published during the selected timeframe. These KPIs help track overall output (number of posts), reach (views), interaction (likes, shares), and content effectiveness (engagement rate).
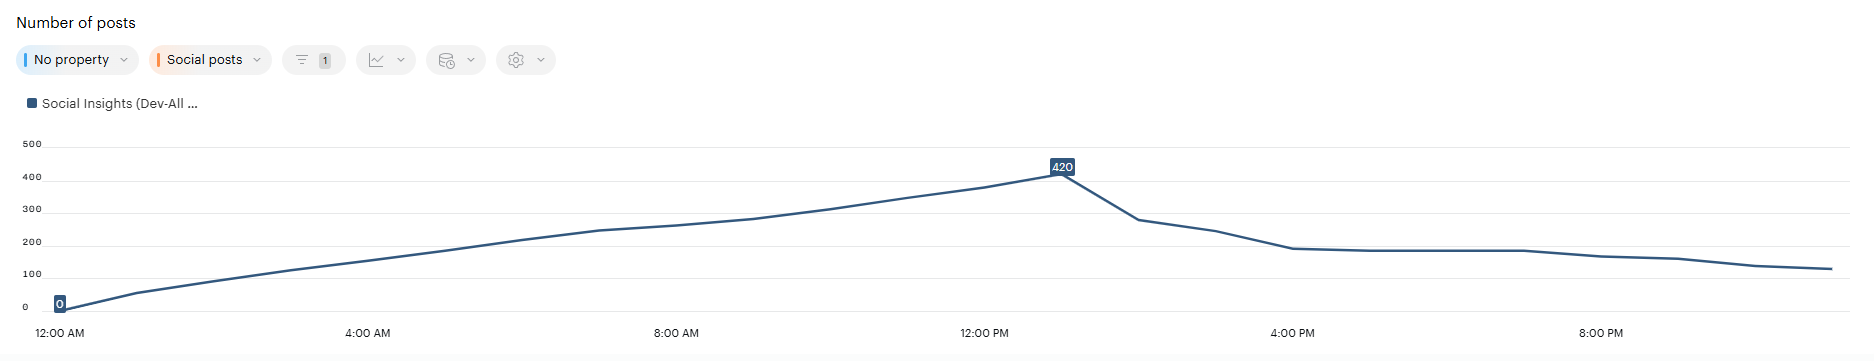
Number of posts
A timeline showing the evolution of publishing activity, helping identify trends in post volume and pacing over the selected period.
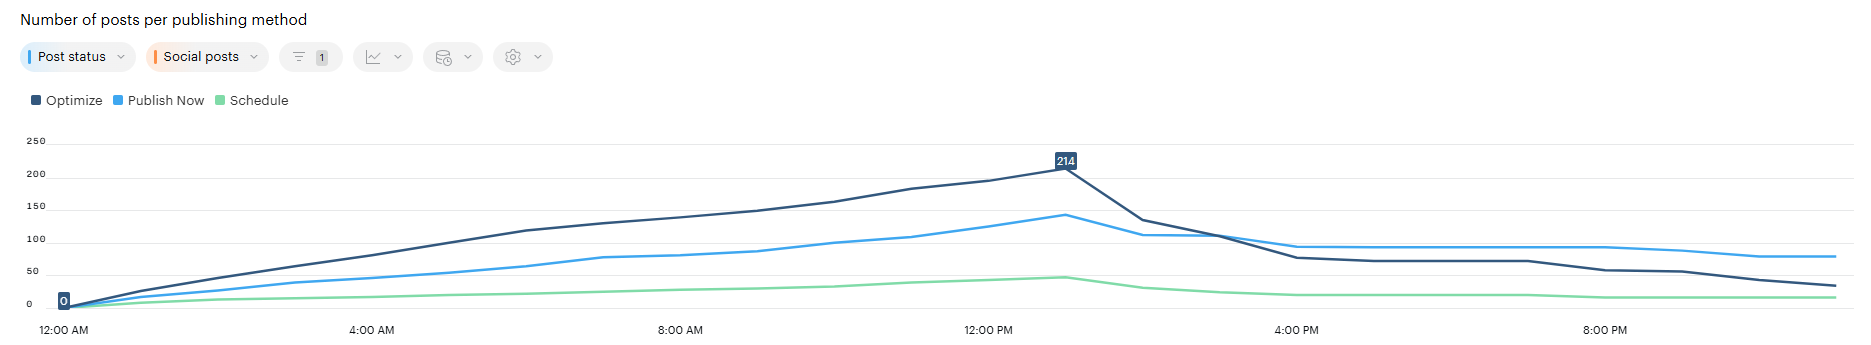
Number of posts per publishing method
Shows how publishing volume is distributed across different publishing method.
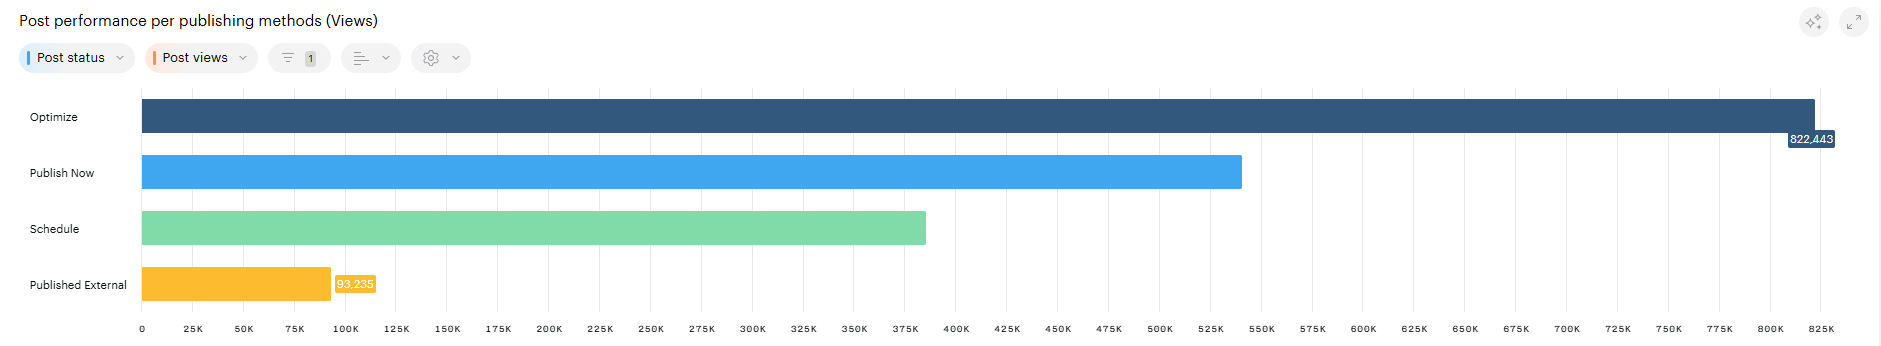
Post performance per publishing methods
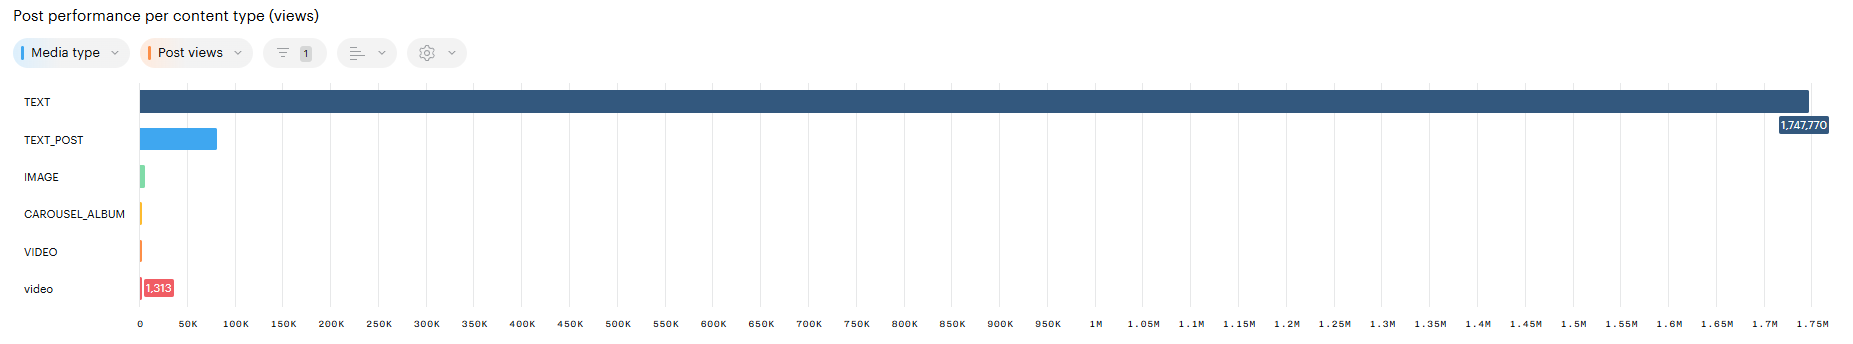
Compares publishing method by volume and performance, providing insight into how method impacts results. The tile below shows the impact of different post formats on views.
Post performance per content type
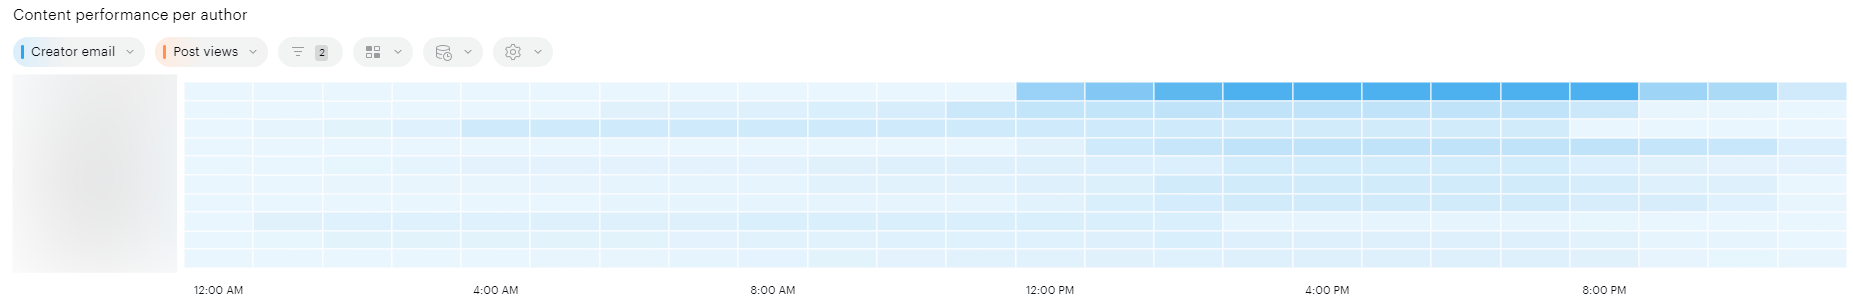
Content performance per author
A heatmap showing post views distributed by author and time of day. This visualization helps identify posting patterns and optimal publishing windows for each contributor, making it easier to align future content strategies with individual performance trends.
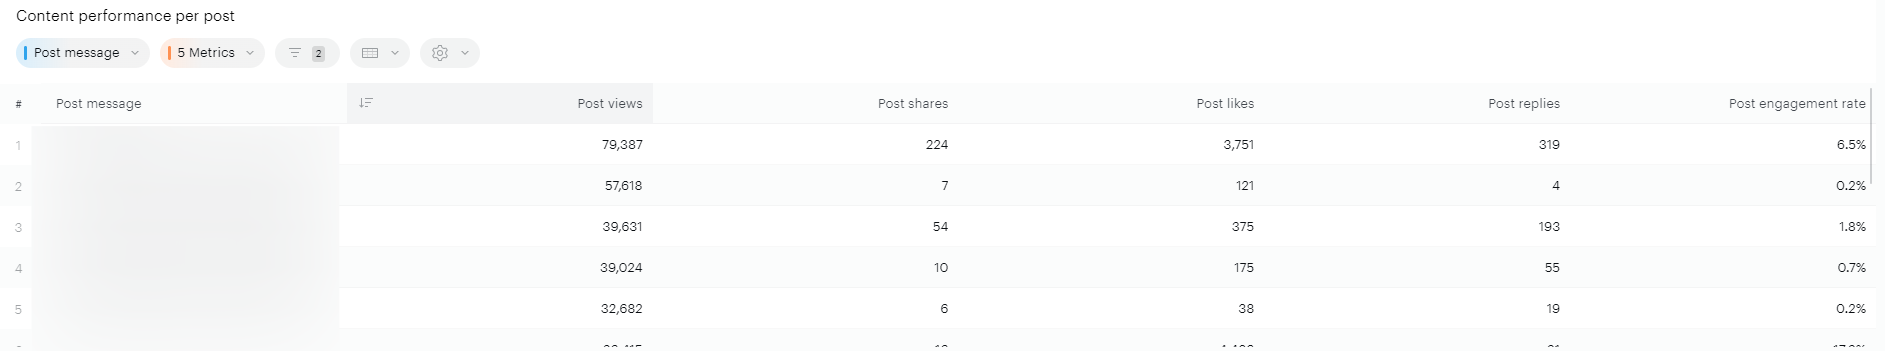
Content performance per post
A detailed table listing posts published during the selected period, along with their performance metrics — including views, shares, likes, engagement rate, and more. This view allows for a post-by-post analysis to identify standout content and uncover patterns in what drives engagement.