Stream Inspector
What is Stream Inspector?
Stream Inspector is a real-time data auditing tool.
It allows you to check your implementations and continuously improve the quality of your audience measurement data, regardless of the device from which the data was collected.
You can access it from the Data Collection Portal, in the "Tools" menu.
Note
Although Stream Inspector was designed for auditing events generated by "Piano Analytics Tagging" methods, "AS2 Tagging" hits are taken into account.
To know the main differences, as well as the advantages of "Piano Analytics Tagging", please refer to the relevant documentation.
Configure your session
Stream Inspector works in collection sessions.
A session corresponds to a set of Analytics events collected in order to audit the data generated from your scope of collection (websites, mobile applications, servers, etc.). It can be defined by a number of events collected, or a specific time period.
General configuration
The general configuration of a session can be broken down into four main steps.

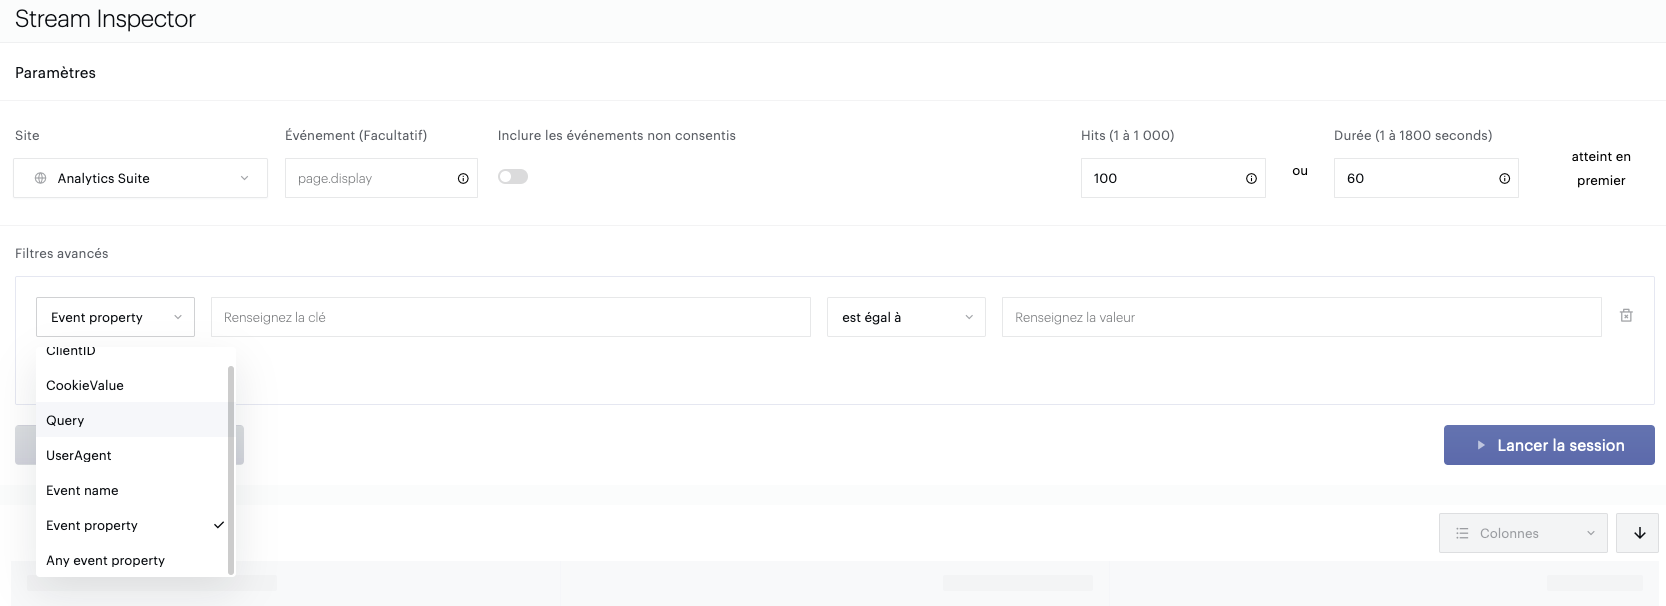
First, you will need to select the site(s) from which you want to launch your session. There is no maximum number of sites!
You can also specify a specific tagged event. If you just want to audit your pages, you can launch your session on the "page.display" event. This setting is not mandatory, and only works if you use the "Piano Analytics Tagging" methods.
Then, you will have to indicate if you want to include the non-consented events or not. This setting is based on the "visitor_consent" parameter of your events ("vc" for "AS2 Tagging"). If you decide to not include non-consented events, events with a "visitor_consent" of false will not be included. Visitor_consents that are set to true, or do not exist, will be included.
Finally, you will need to set the limits of your session. To do this, you can choose a number of events after which the session will stop, or a time limit (in seconds).
You can then launch your session by clicking on the "Launch Session" button!
Advanced filters
We also offer advanced filters to better target the selected events during the sessions.

ClientID
The ClientID is the client side identifier generated by the cookie (web) or the mobile SDK.
This identifier is accessible directly within the event (or hit) in the "idclient" parameter.
This allows you to filter your session on your traffic, when you know your ClientID.
More details here.
CookieValue
The CookieValue is the identifier of the server side cookie if you use this technology to track your visitors.
This allows you to filter your session on your traffic, provided you know your CookieValue.
Query
The Query corresponds to the business content of your Analytics queries if you use the "AS2 Tagging" methods.
For example:
https://logs1407.xiti.com/hit.xiti?s=577628&idclient=123456&p=corporate::carreers::homepage&x1=mysitevariableAll parameters after the "?" character are elements of the "Query String" of your hit.
You can add a "p=" filter for a page, "x1=" for a site indicator, or any other of your tagging parameters.
If you are using the "Piano Analytics Tagging" methods, we recommend that you use the "event name", "event property" or "any event property" filters.
UserAgent
The User Agent is your device’s digital fingerprint.
It allows you to filter your session traffic, provided you know your User Agent.
Event name
Event name is the name of your event.
Here you can specify the events you want to audit, regardless of their names.
To add event name filters, you need you to set up "Piano Analytics Tagging".
Event property
Event property corresponds to the properties of your events.
Here you can specify the specific values, linked to specific properties, that you want to audit, regardless of the event to which they are attached.
Filters on event properties need you to set up "Piano Analytics Tagging".
Any event property
Any event property works like the previous filter, except that it does not require you to select any particular property.
It is like asking for all events containing any property including the value you are looking for.
Filters on Any event property requires "Piano Analytics Tagging" to be set up.
Session
Table
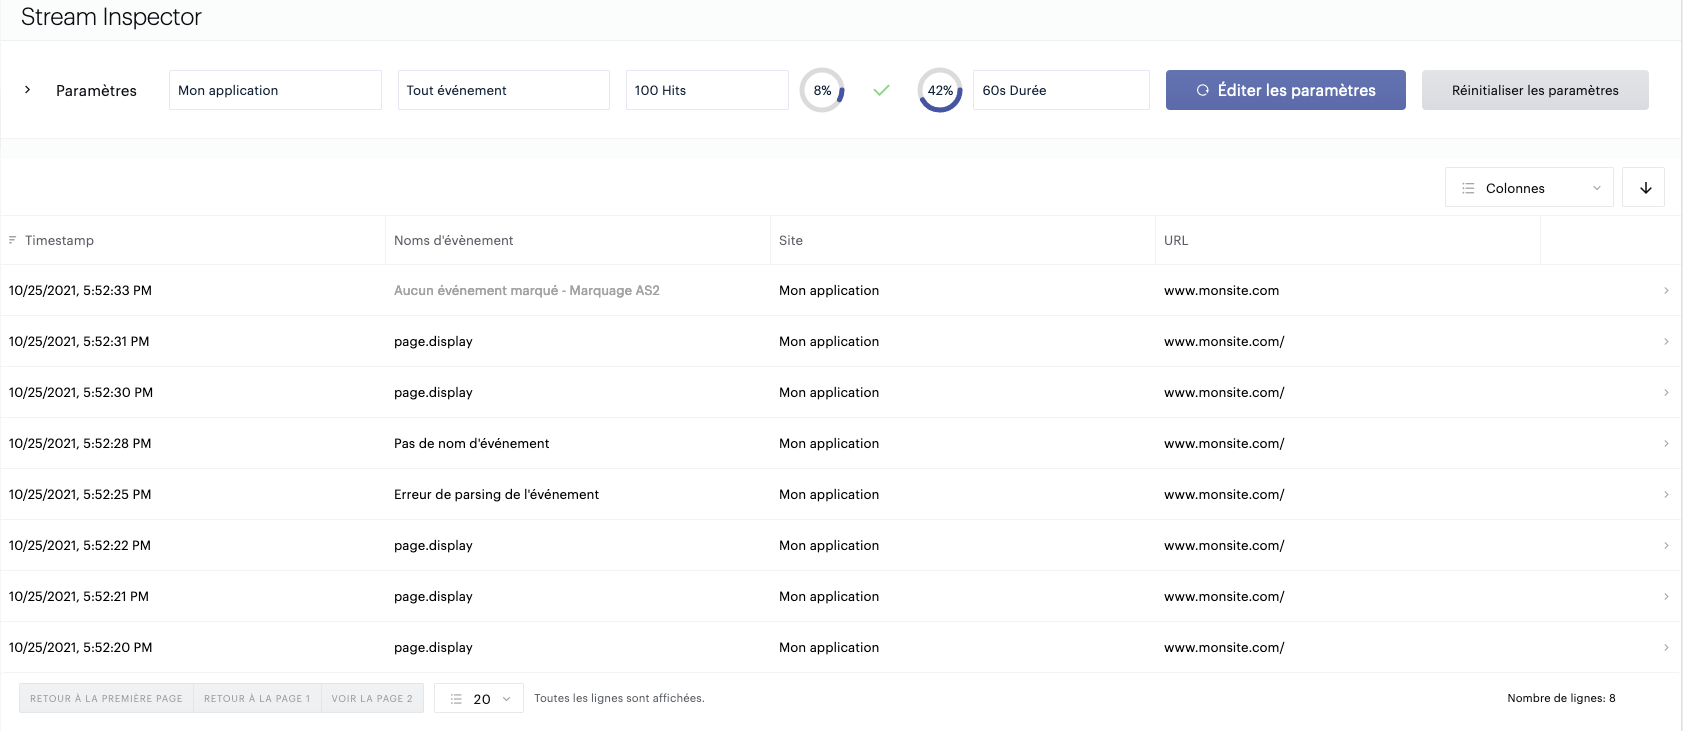
Once your session is launched, you will see all the events collected in real time and meeting the criteria previously selected:

For example, if you go to a site you own that has low traffic, you can launch your session and watch your interactions on that site in real time happen in the Stream Inspector table!
You should not be unfamiliar with this table; it is the one you already have in Explorer or Data Query. The difference is that it is constantly updated based on the events collected during your session.
For example, you will find the column system that allows you to select or remove certain information from the table that may or may not be relevant.
You will also find the same page system we usually provide.
One column should grab your attention, "Event names". This one can take four different values:
"No events tagged - AS2 Tagging" : This means that the information collected is a "hit", collected via the "AS2 Tagging" methods. You will not benefit from all the advanced auditing advantages provided for events.
"page.display" or any event name in general : This means that the collected information is an event, collected via the "Piano Analytics Tagging" methods. It also means that the collected event is correctly formatted and will be correctly processed by the Piano Analytics suite..
"Event parsing error" : This means that the collected event has an error in its structure (JSON). You can click on it to find out the cause.
"No event name" : This means that the collected event has no name, but it is correctly formatted. You can click on it to find out where it was generated from in order to correct your tagging.
"Request" panel
Once the table is configured the way you want it, you can start your auditing work by selecting each event you are interested in.
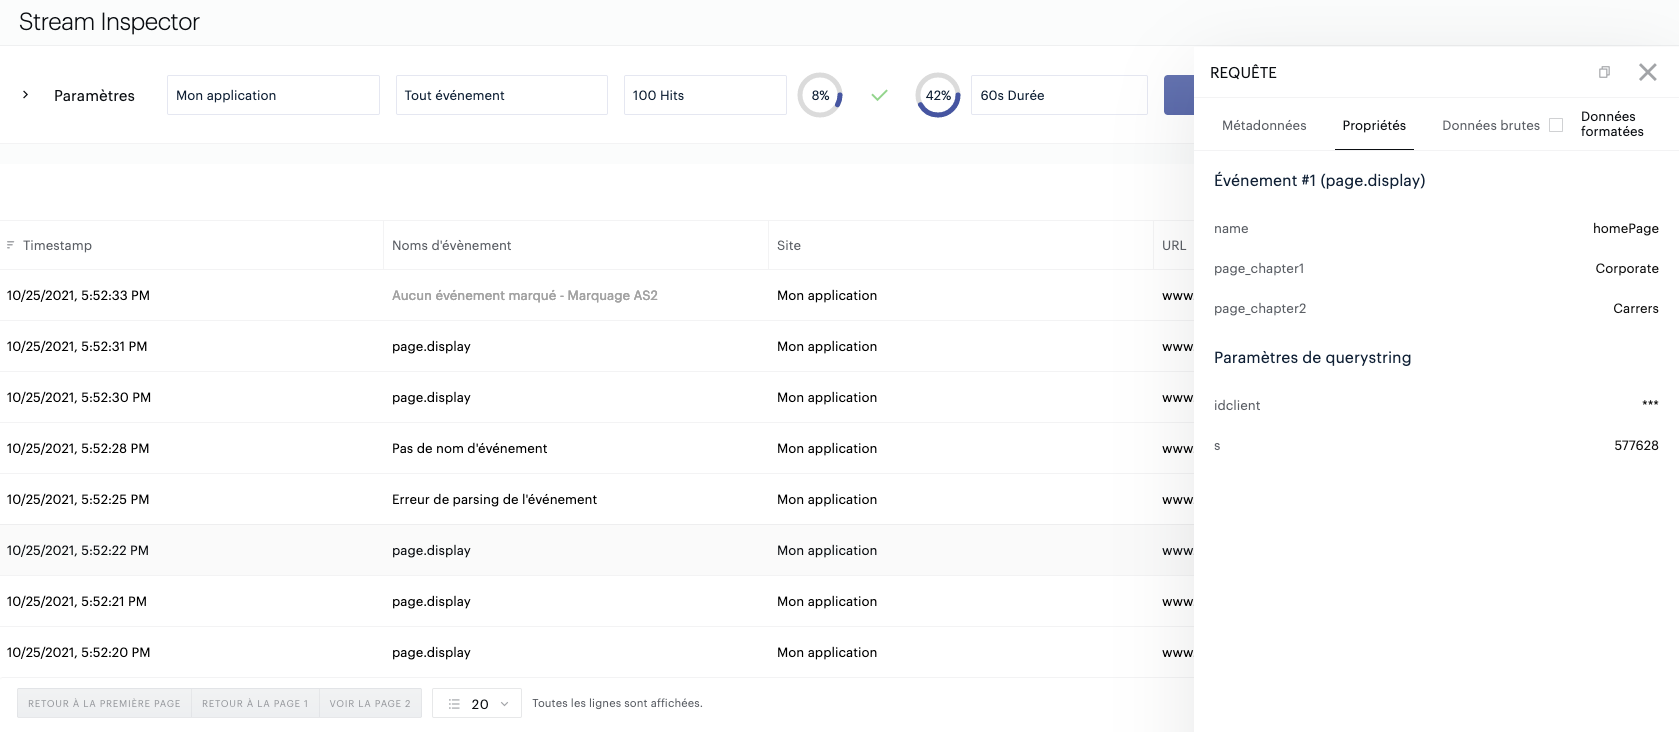
By clicking on an event, you will open the "request" panel:

Metadata
The "Metadata" tab contains all the specific information gathered by Piano Analytics.
You will find information such as the User Agent, the timestamp of the event, the URL from which it was generated, the site number on which the event was collected or whether it came from a multi-hit or a secure collection protocol (ssl).
Properties
The "Properties" tab is at the center of your audience measurement tagging business. It contains all the information related to the events tagged on your perimeters.
It is the focus of your audit, and the main reason to carry out sessions.
There are two types of information here:
Event (Piano Analytics Tagging): You'll find the broken-down list of properties of your event. This will be in the form of "key value".
Query String parameter: You will find the list of all information that is not present in the event. The site number, or the customer id for example.
Note
If you are using "AS2 Tagging", you will not observe any event. All your business information will be in the Query String as a hits parameter.
Raw Data
The "Raw Data" tab contains the event (or hit) as it was collected.
This is the form in which we receive it, generated from your users' browsers or devices.
Important
The parameter "idclient" will always be hidden in Stream Inspector. The raw data you access in Stream Inspector cannot be personal data.
Restart a Session
Once your audit is complete, you may want to restart a new session.
To do this, you have two choices:

"Edit settings": Here you can restart the session with the same settings as the one you just finished. This is a shortcut to restart a session that best matches your needs!
"Reset settings": Here you can restart a blank session, without taking into account the previous settings. If your session was not relevant, you might as well start from scratch!
Export
If you are happy with your session, and once it is over, you may want to share it with your colleagues:

If some information is not correctly tagged, or if some information is missing, using the export feature will allow you to send a csv file with all the information about the session to the people in charge of tagging.
How to activate Stream Inspector?
Stream Inspector has 3 requirements in order to be accessible:
Piano Analytics: Stream Inspector requires the power of the Piano Analytics engine in order to function. It is not accessible in Analytics Suite 2.
Access to "available raw data": The use of Steam Inspector requires access to a certain type of data. There are two ways to provide this access:
Ask your administrator to log in to Stream Inspector and accept access to the raw data via the pop-up window that will appear
Ask your administrator to send a message to the support center to request access to the raw data
This is a one-time operation and will work for the entire organization. More info in the Privacy Center.
Set up tagging rights: You will need to have the appropriate rights in order to access the Data Collection Portal interface, and Stream Inspector.
If you don't have these rights, don't hesitate to contact an administrator who will be able to give you the rights you need.
Use cases
Please check out our webinar if you want to see different Stream Inspector application cases and get more value out of them in terms of the quality of your Analytics data.
