Tag Inspector
Description
To check your site's tagging manually, we provide a browser extension for free called Tag Inspector.
It lets you see clearly all parameters generated by your tagging, as they should be listed in the interface.
But most importantly, it gives you warnings on the value sent in all parameters if they do not match the expectations, or if their format can be improved.
If you are logged in to your account, it automatically gets the detailed information of sites you've been given access to (gets your custom domains, replaces the site number by your site label etc...).
Extension installation
To install Tag Inspector on your Google Chrome browser, please get on the dedicated page on the Chrome Web Store.
Then simply click on the install button in the top right corner, and get follow these steps to access the analysis:
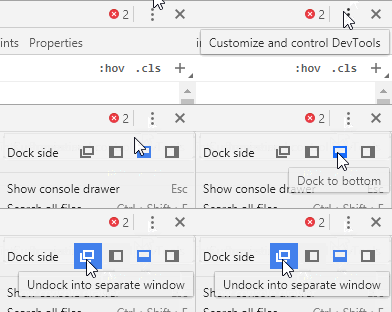
Open Chrome Dev Tools (F12 or CTRL/⌘+Maj+i)
Note: Popout or bottom dock layout recommended

Switch to Tag Inspector tab

Start navigation on the tagged website
Optional
Login to get even more information (site names, custom variables labels, ...)
Hit table
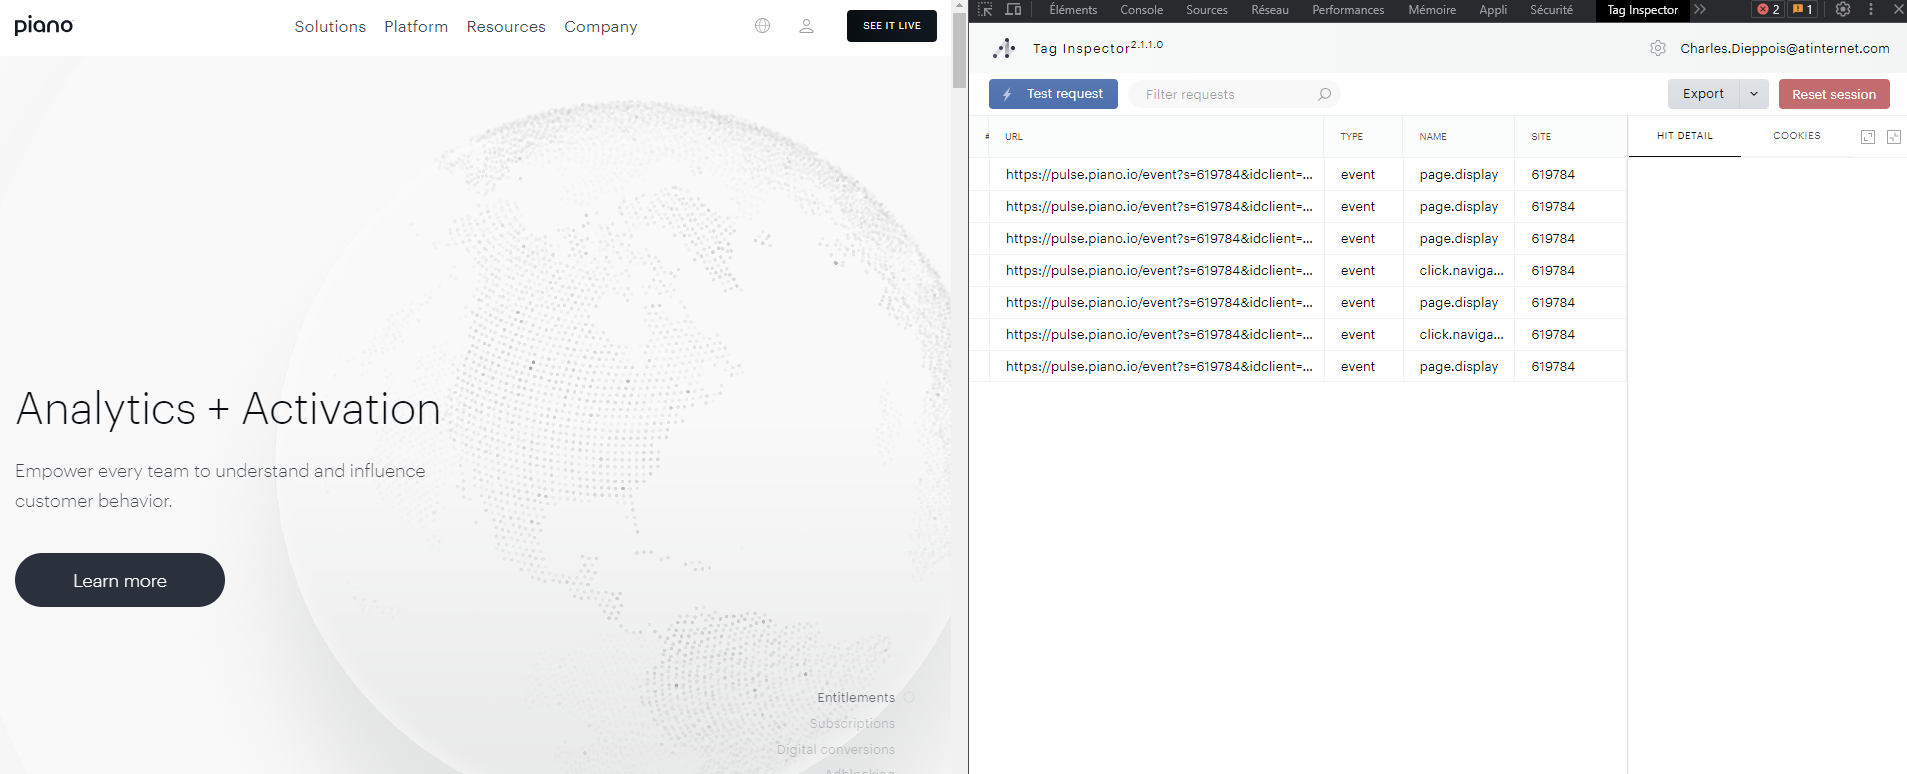
In the global hit table you will find many information to identify which step or hit you need to check.
Hit position (#)
URL that generated the hit
Hit type
Hit(s) total (if part of multi-hit)
Event label (page name, click name...)
Hit siteId
Hit warning (orange flag on the beginning of the line)

Hit detail
Under the right panel you will find 3 sections the first one is Hit detail, showing you the details of all hits identified.
Here is all the information it gives:
Context variables
Metadata
Hit warning (potentially)
Events
Under the events tab you will find the payload detail. The event name as well as all other properties (with the property type) collected onto this page.
Cookies
It shows all Piano Analytics cookies stored by the browser.
You will find cookies deposited from your current tab on a tagged site, but also Piano Analytics cookies generated from other sites (even closed ones).
Here is all information associated to the Piano Analytics cookies detected:
Cookie name
Domain
Path
Expiration date
Flags (hostOnly / httpOnly / sameSite / secure / session)
StoreId
Value (it may store various information depending on the cookie)
Actions
There are a few interactions available to help you monitor or focus on the right hits.
Here is the full list of available actions:
Filter hits
You can look for a specific hit by typing in the search bar above the Hit table.
Sort hits
All column titles of the Hit table can be click to sort hits ascending or descending, alpha-numerically.
Delete hits
You can delete a hit of your Hit table by doing a right click on it and clicking on Delete hit.
Flag hits
You can flag hits to focus on specific hits by doing a right click on it and clicking on 1 of the 3 colors available.
Copy raw hit
You can copy the URL of the hit that the extension detected, by doing a right click on it and click on copy raw hit.
Copy details
You can copy to your clipboard the JSON content of your hit details by doing a right click on it and click on copy details.
Test hits
If you want to test a hit, simply click on the dedicated button above the Hit table, and paste the hit URL then validate it.
It will be analysed just like any other hit in Tag Inspector.
Export hits
You can export the hits detected in Tag Inspector to JSON or CSV by clicking on the dedicated button above the Hit table.
Reset session
You can clean your Hit table from all hits, by clicking on the Reset session button above the Hit table.
Login
If you are logged in Piano Analytics, our session cookie will be used by the extension to log you in automatically.
It can be very helpful to get information not available in the hit, but in our interfaces such as values matching an ID for specific parameters.
Edit settings
By clicking on the steering wheel in the top right corner, you can edit several settings:
Pick columns for the Hit table
Collection domains: Manually add a data collection domain by typing it down if needed (CDDCs for example)
Follow navigation: to display the last detected hit details automatically
Display warnings: to display all descriptions on warnings identified
Decode hits: to automatically decode values listed in the hits
Note
If you have a CDDC, you'll need to add the domain in your extension settings, to get them.
