
You can annotate reports to add relevant contextual information — such as product launches, sales periods, server issues, or any other significant events.
Adding an annotation
Annotations (called “events”) can be added to any evolution graph within a report.
To add an annotation:
-
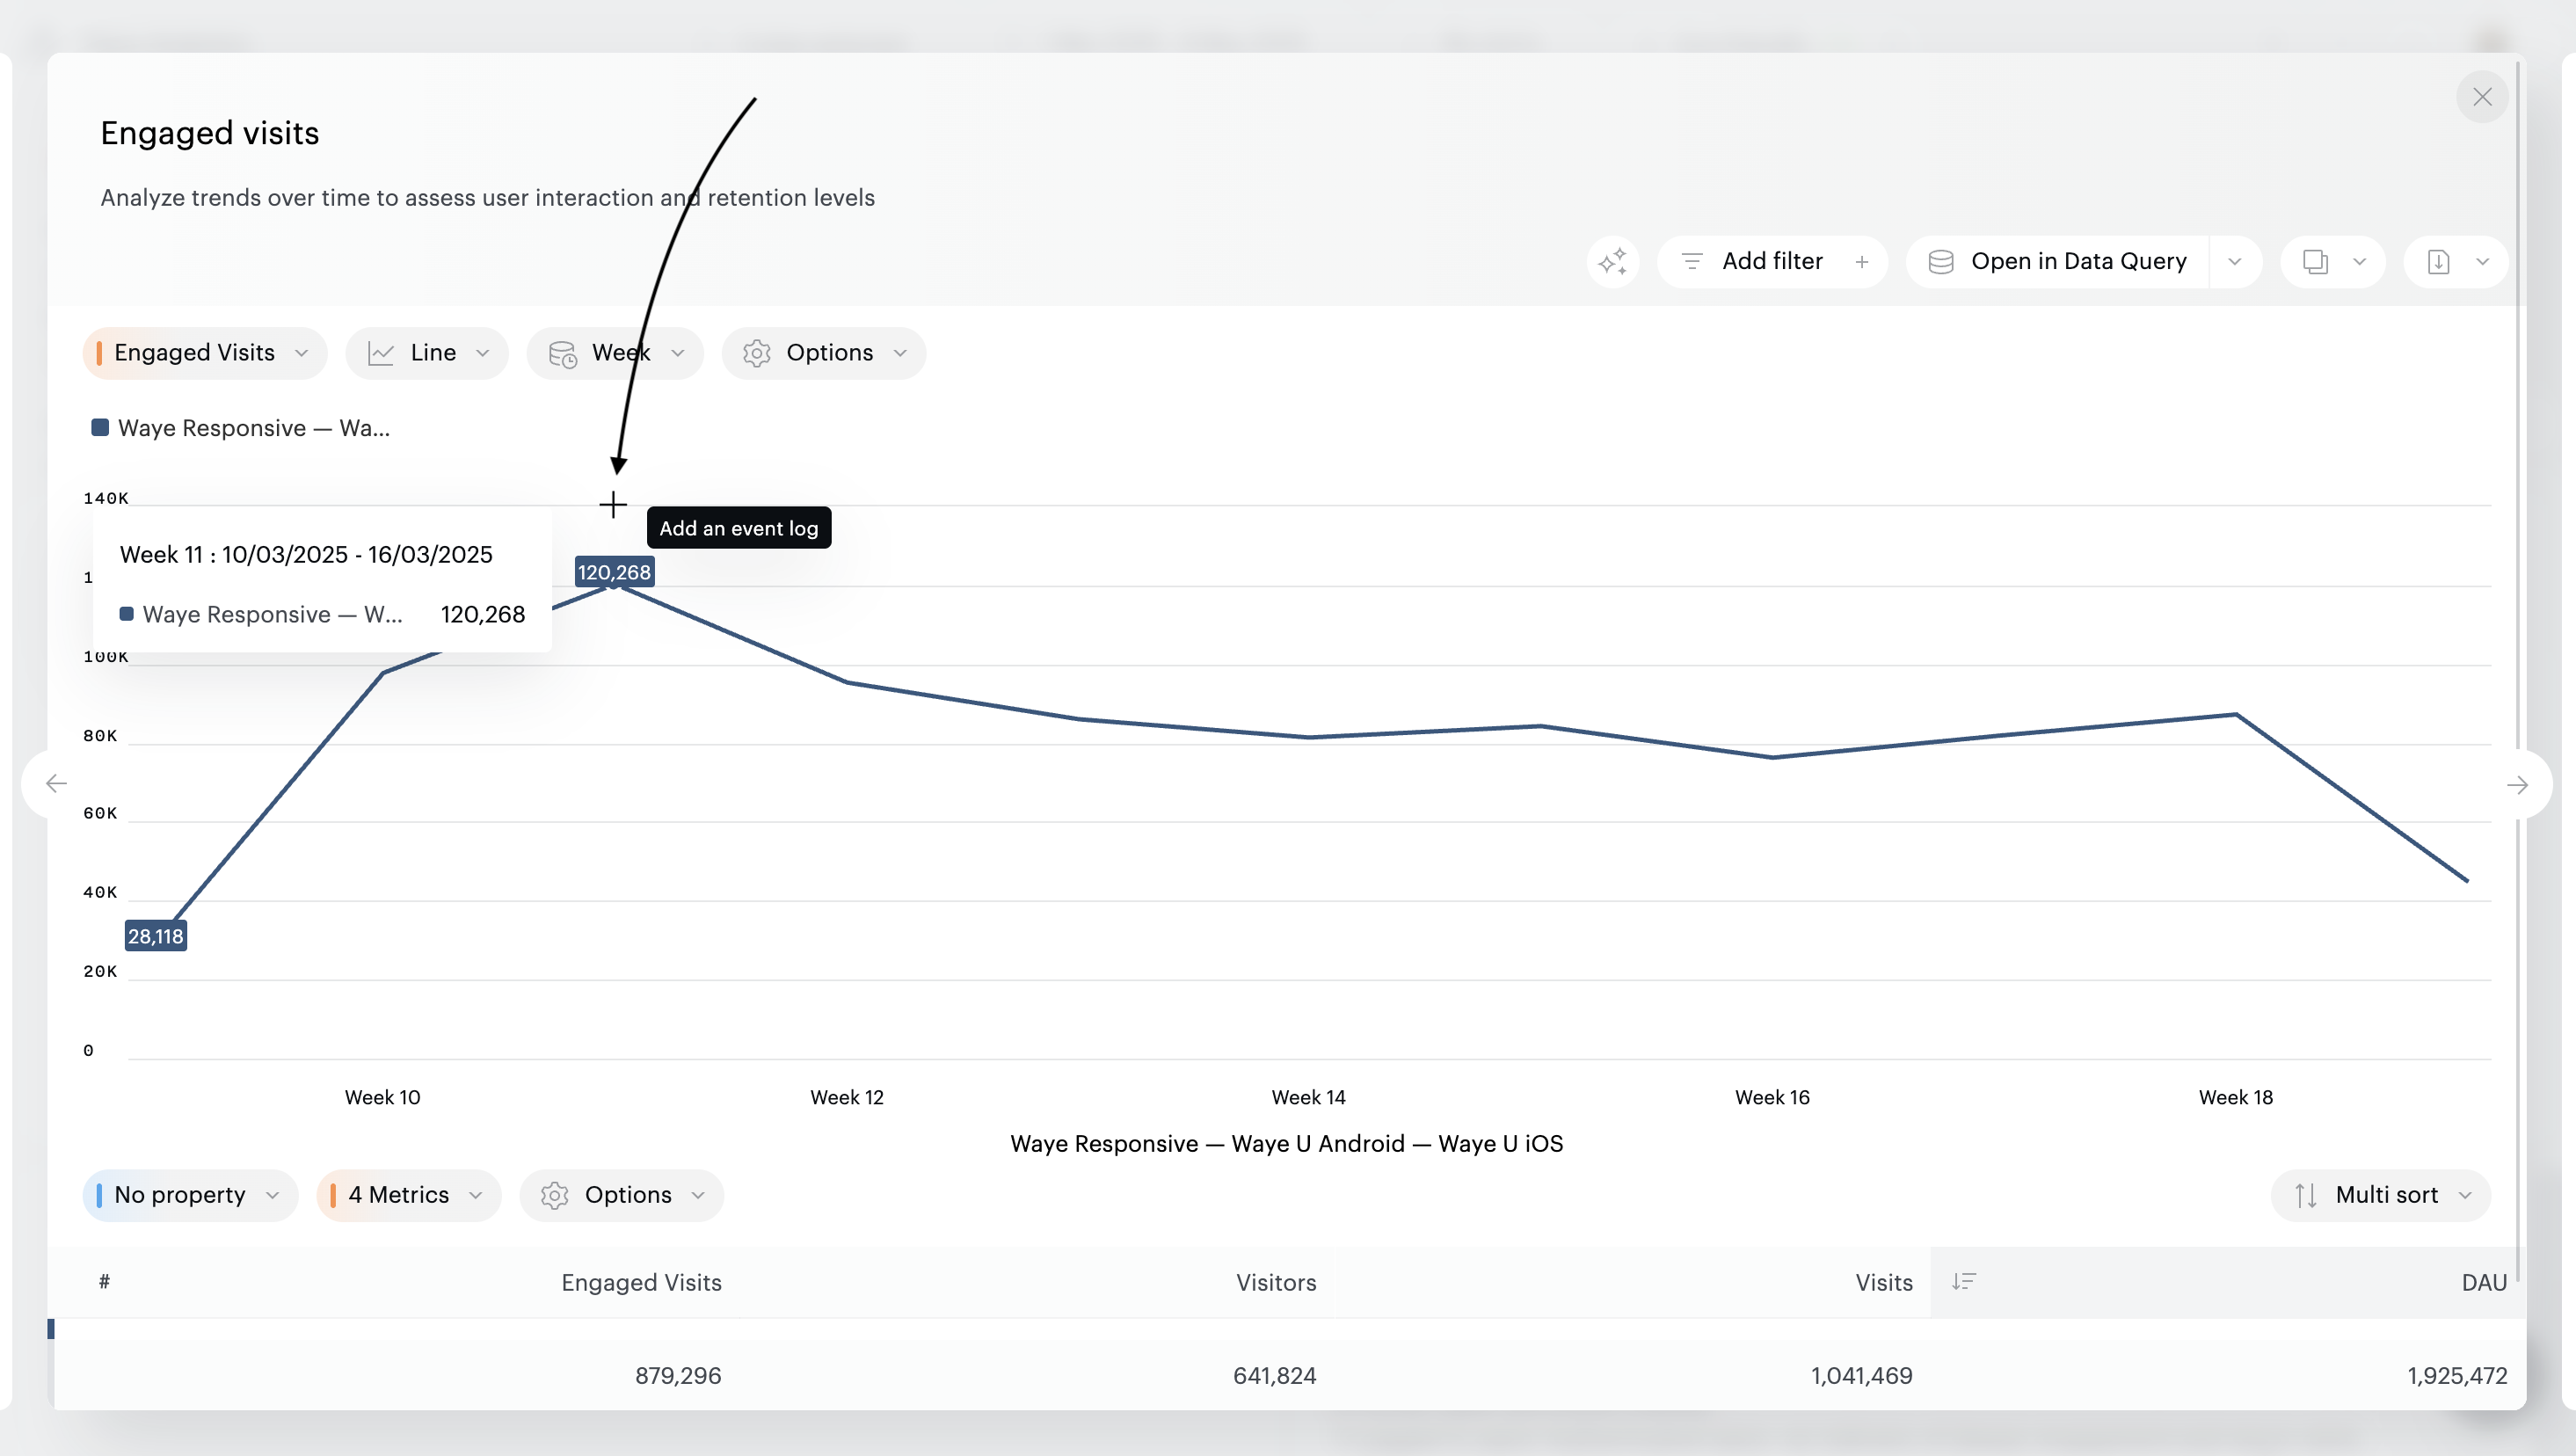
Hover over any point on the graph.
-
Click the “+” icon to add an annotation at that specific moment.
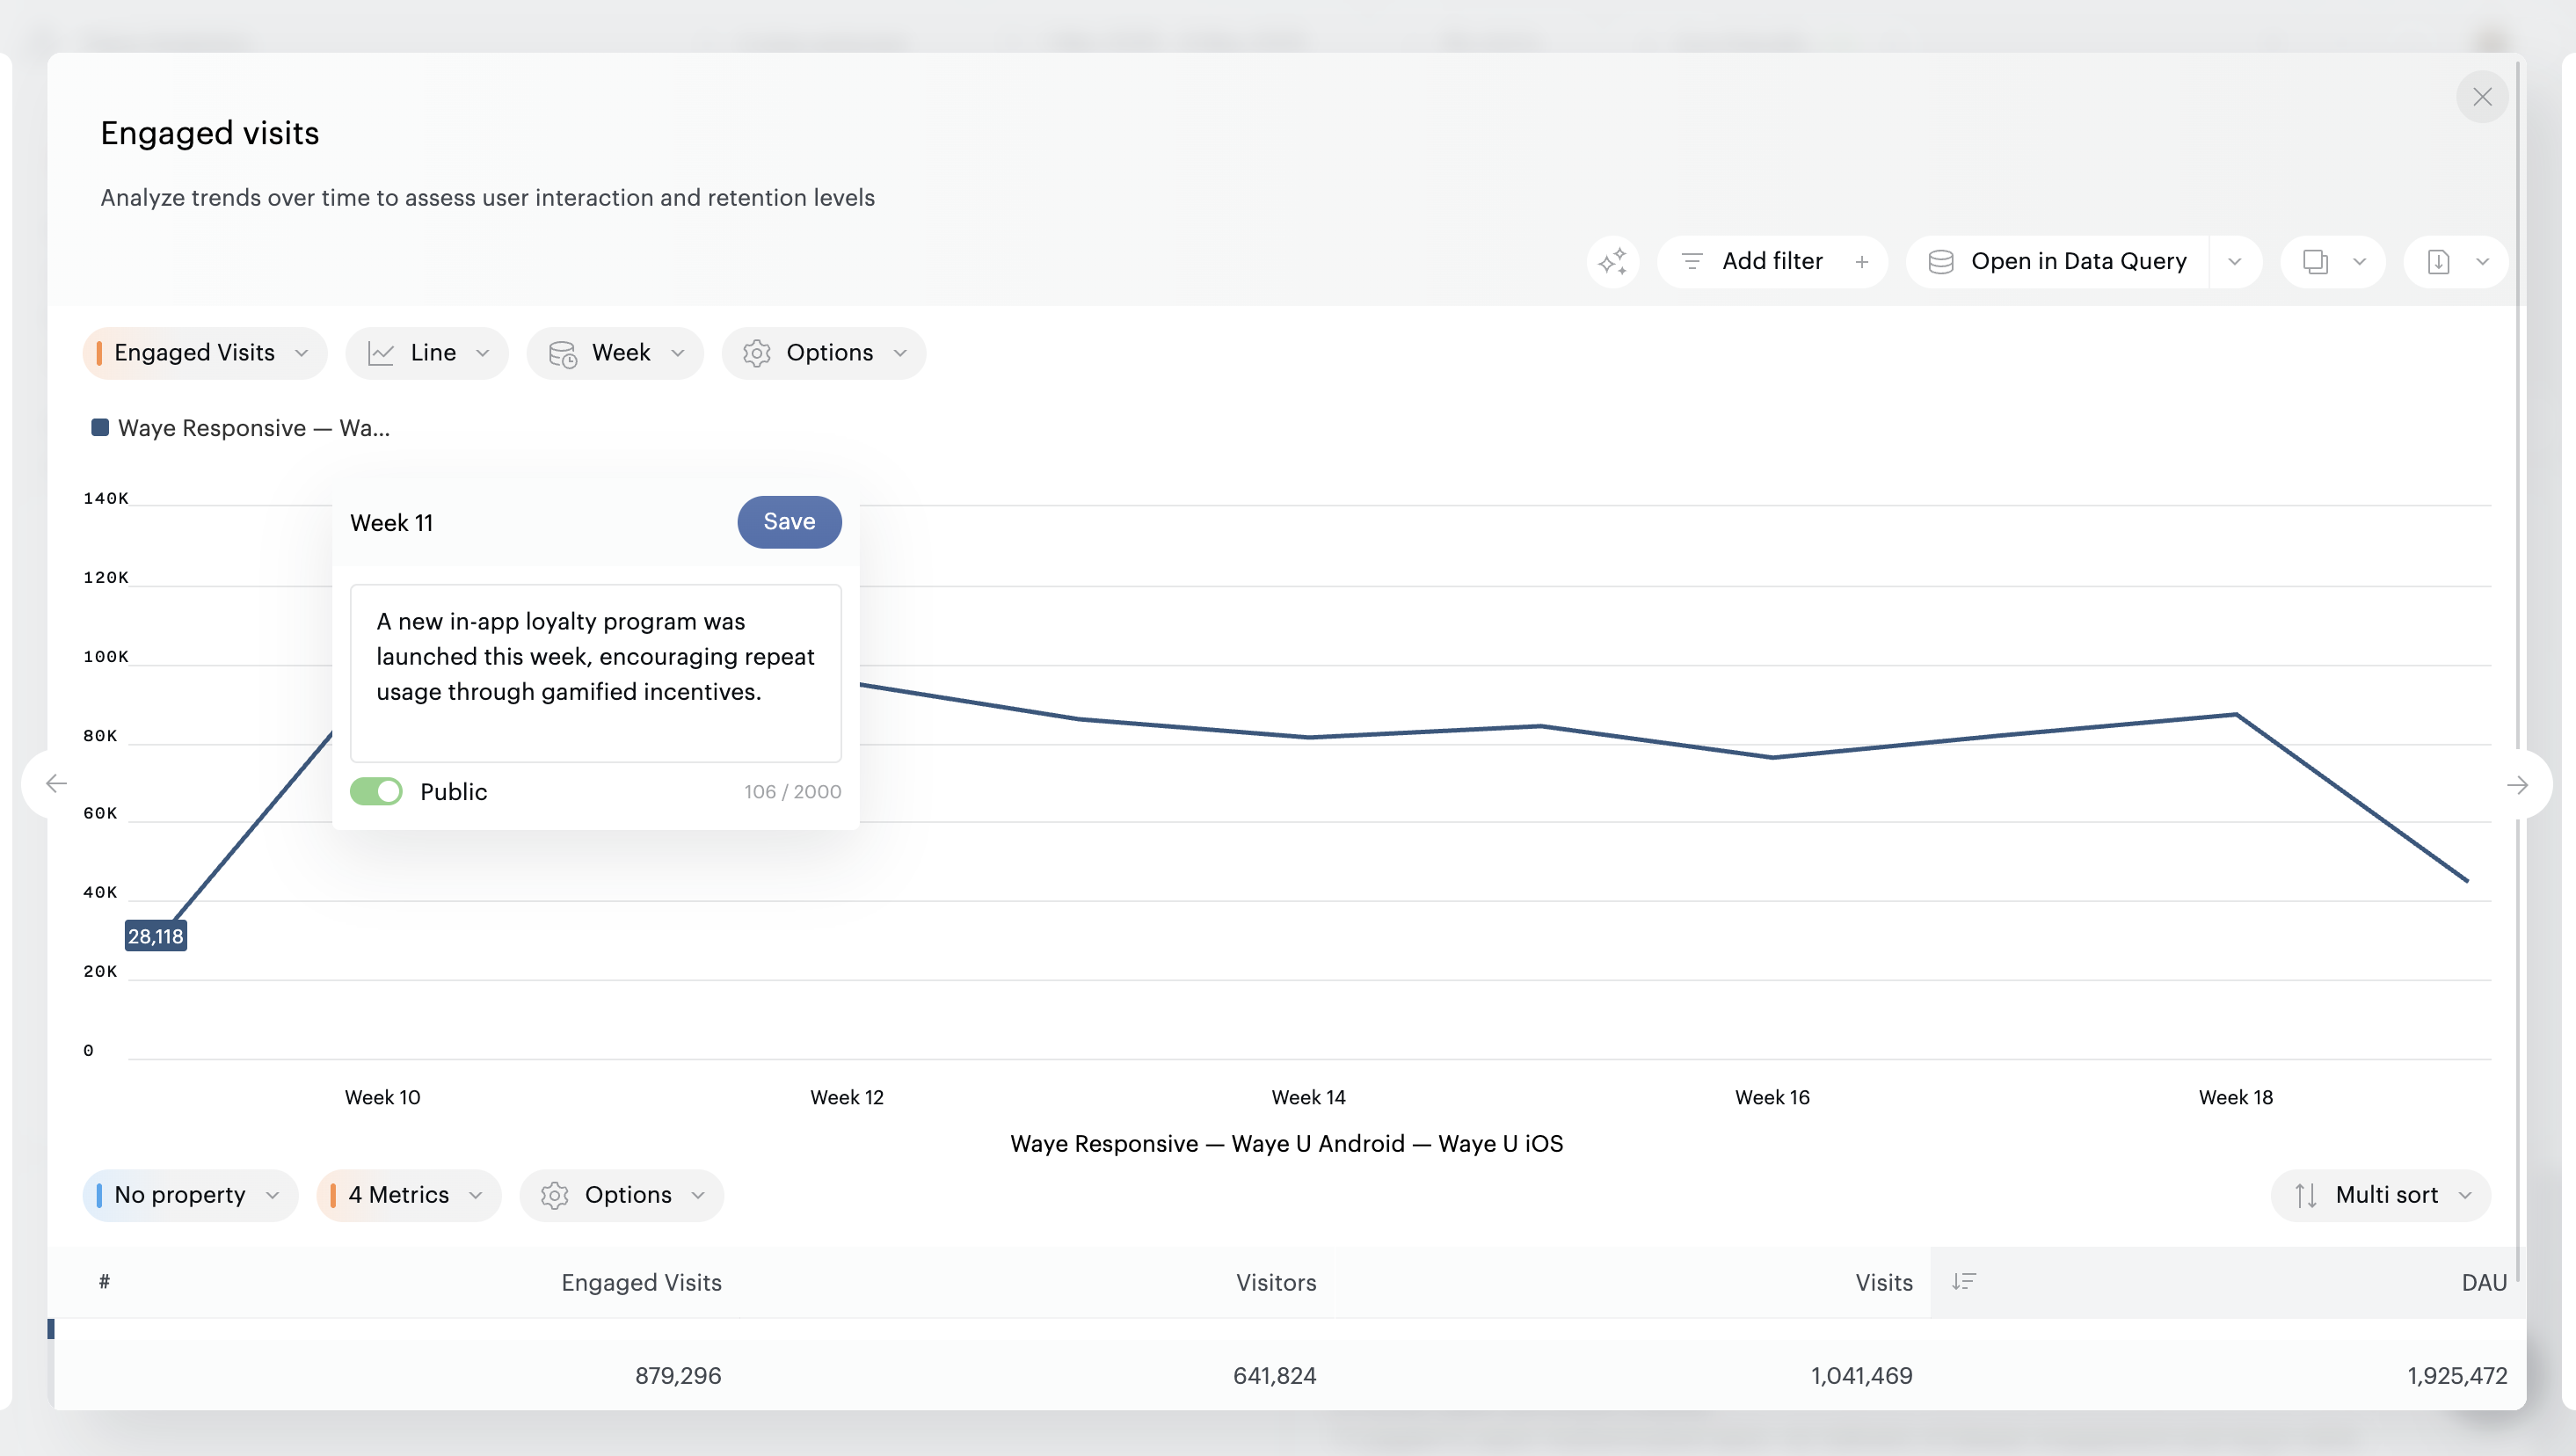
You can then enter the text for the annotation and set its visibility: by default, annotations are private, making them visible to you only. Click on the “Public” toggle to activate public status: all members of your organization will now see your annotation. Don’t forget to click on “Save”.
Viewing and managing annotations
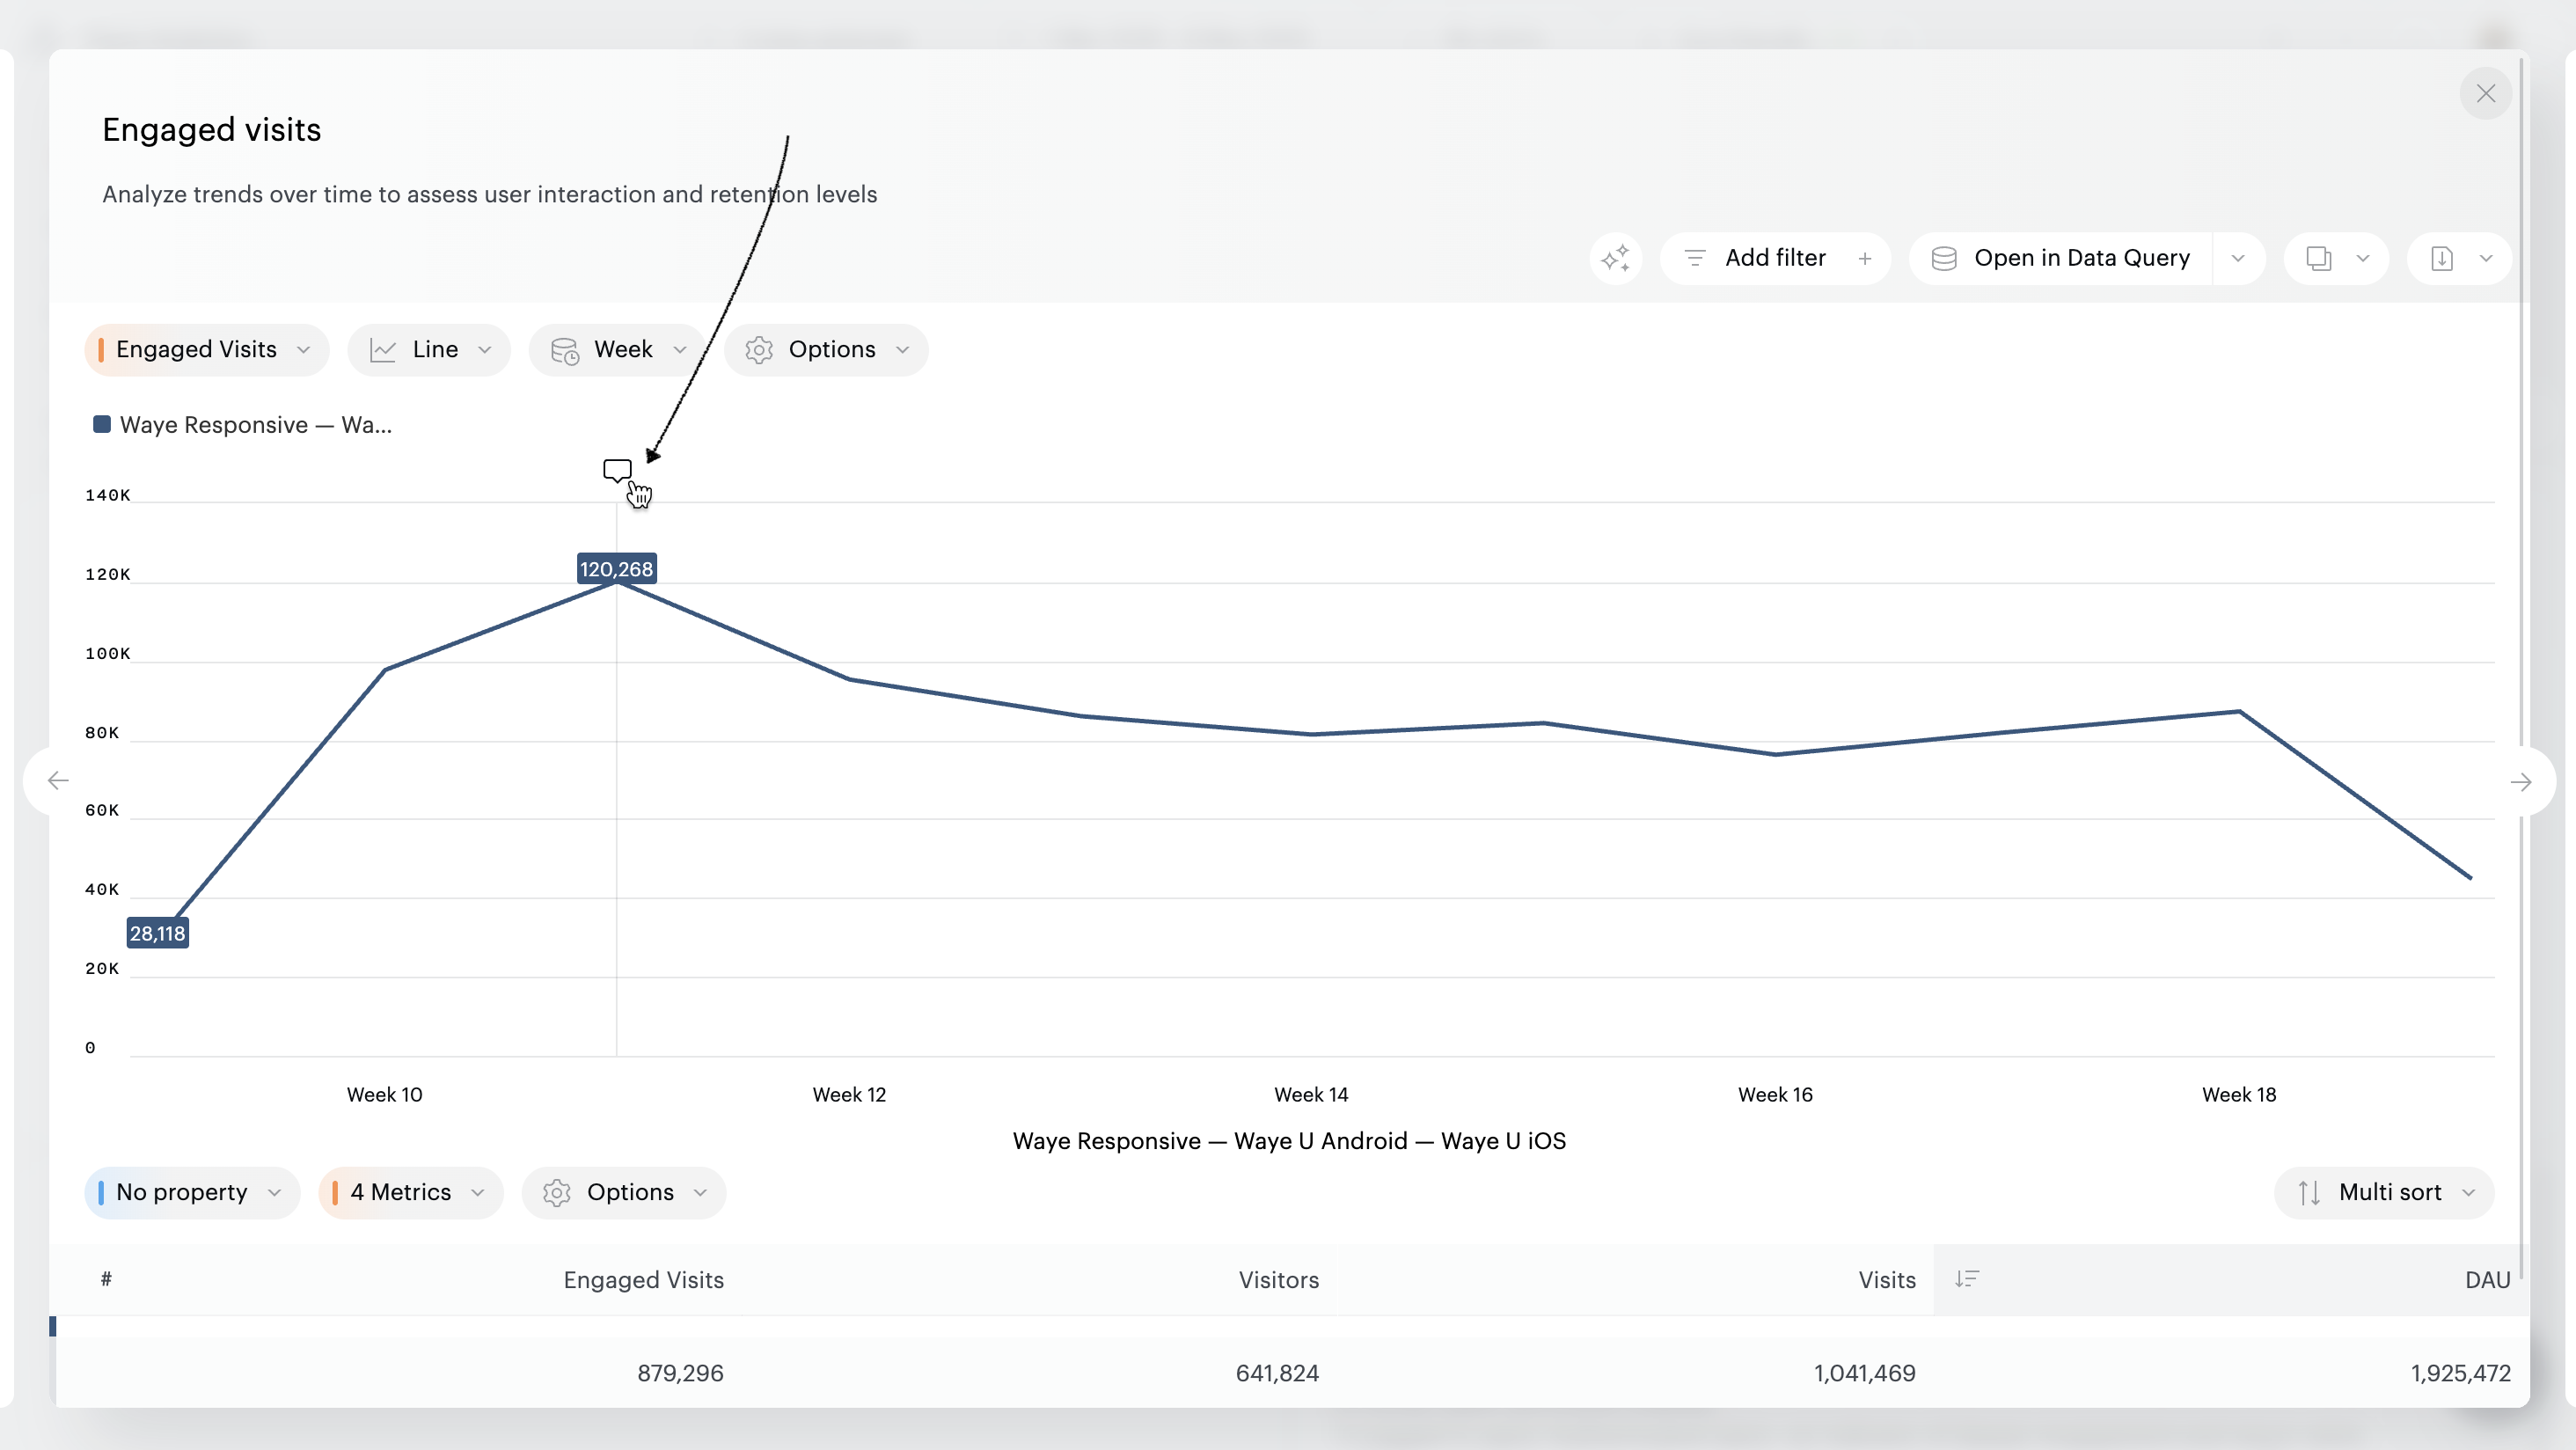
Once added, events will appear as speech bubbles above the graph.
-
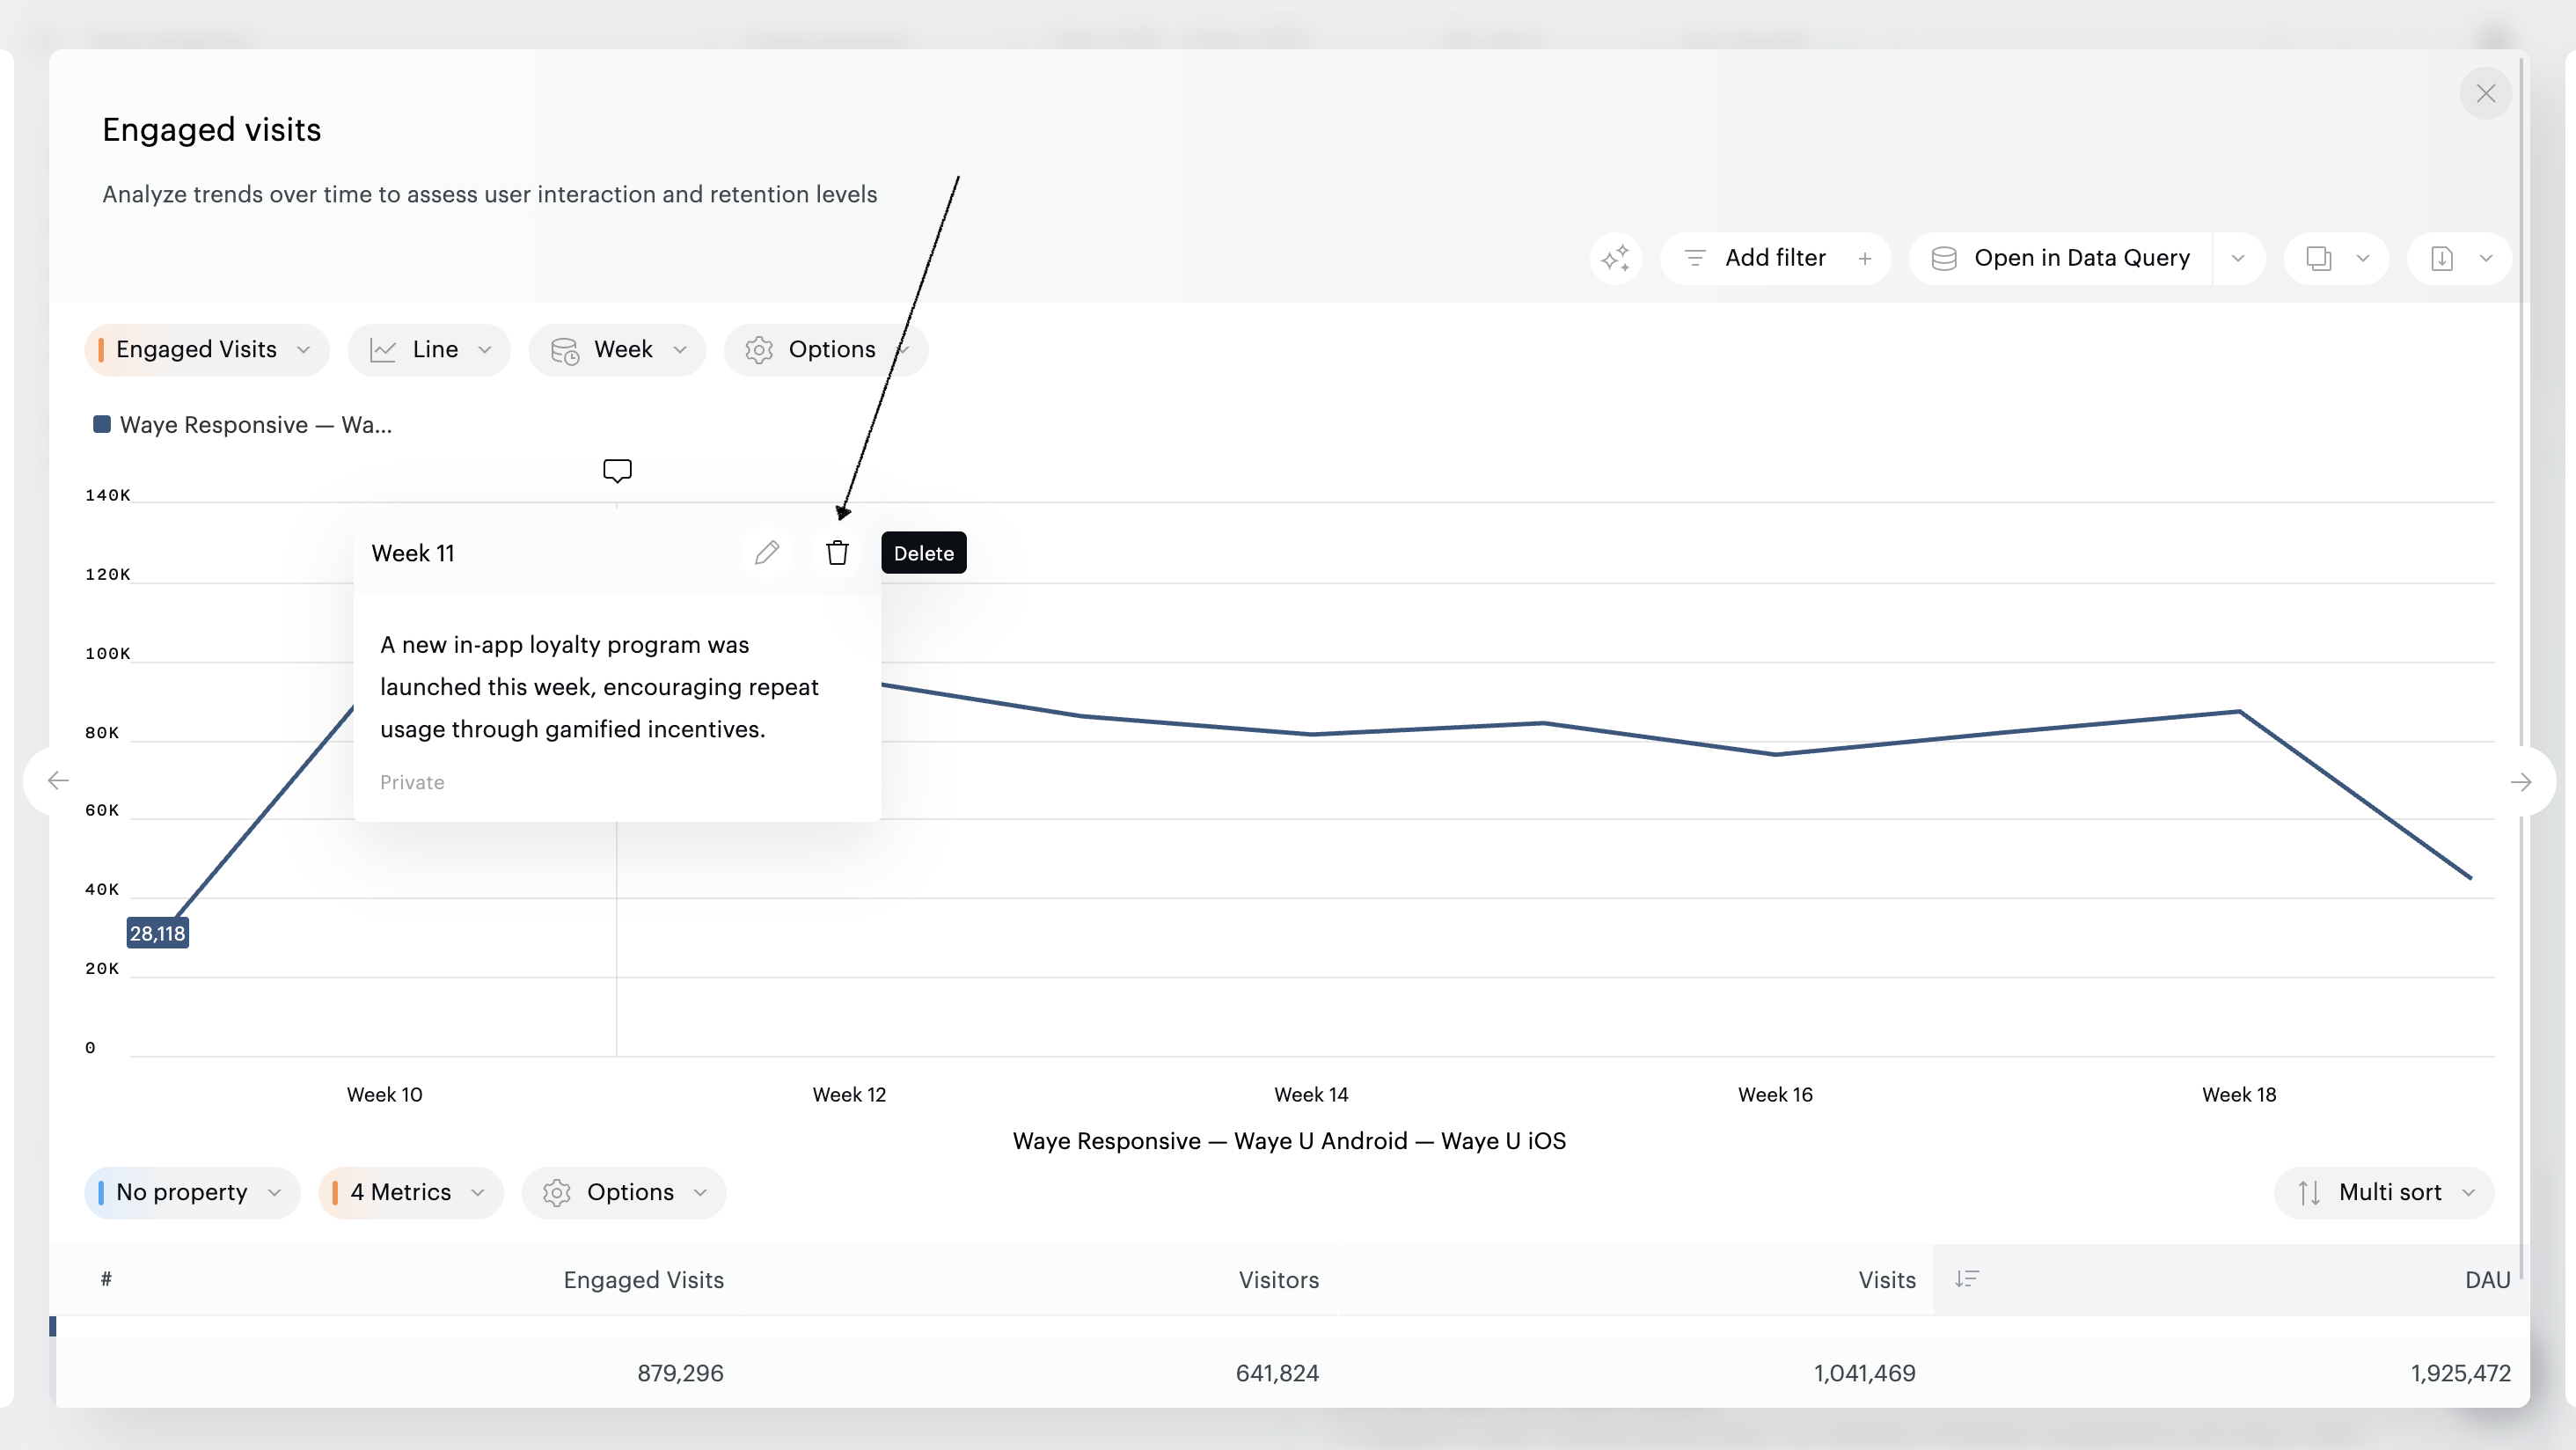
Click on a bubble to view the annotation.
-
To modify or delete it, once opened, click on the pencil or the trash icon.
To avoid visual clutter, you can hide the event markers. Simply open the chart options and deselect “Display events”.
The “Event log” feature is only available on fullscreen tiles and standalone reports.