
Social Insights displays post and handle performance data directly from social platforms such as Facebook and X. Organic social data behaves differently from both traditional event-based analytics and the paid ads APIs many teams already know, so it helps to understand a few key concepts before you start reading your boards.
This guide covers four core principles that shape how to read your Social Insights data: cumulative metrics, the 30-day post tracking window, refresh frequency, and how the analysis period filter applies to your boards.
Data is cumulative
Social platforms report organic post metrics as lifetime totals rather than as individual, incremental events. Every time we retrieve a post's data, we receive its cumulative counters at that moment (total views, total likes, total shares, and so on), accumulated since the post was first published.
This is a different model from the one you may already be familiar with from other analytics tools. Here is how the three approaches compare:
|
Data |
How metrics are delivered |
Example question it answers |
|---|---|---|
|
Event-based analytics (e.g. Piano Analytics) |
Each action is an individual timestamped event, aggregated on demand over any period |
"How many page views happened on Tuesday?" |
|
Paid ads APIs (e.g. Meta Marketing API) |
Metrics are broken down by day, so daily deltas can be summed over any date range |
"How many impressions did the campaign generate last week?" |
|
Organic social APIs (what Social Insights uses) |
A single cumulative lifetime counter per post, updated at each refresh |
"How many views has this post accumulated so far?" |
In practice, this means:
-
The value you see for a post is its cumulative total as of a given day since it was posted (the last day of the analysis period), not the activity generated during a specific time slot.
-
Daily activity breakdowns (for example, "how many views did this post get on Tuesday?") are not provided by the platforms for organic posts, unlike paid ads reporting.
-
Metrics can only grow over time. They never decrease. A post's data is removed once its 30-day tracking window ends, which is covered below.
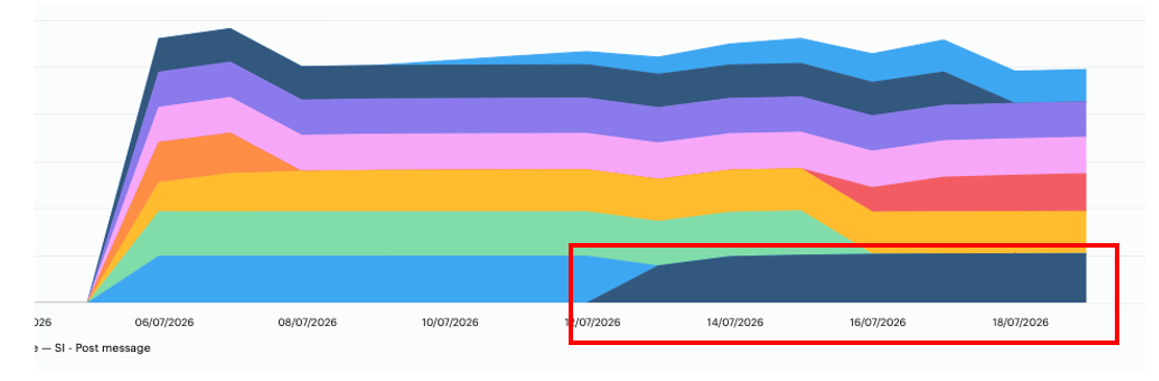
Posts accumulate data over time, quickly at first, then more slowly as the days go on. In the chart below, the navy blue post was published on 12/07/26. It gained traffic quickly through 14/07/26, then leveled off, with only small incremental gains afterward.
30-day post lifetime
We track each post's performance for 30 days from the date it is published. After that, we stop monitoring it.
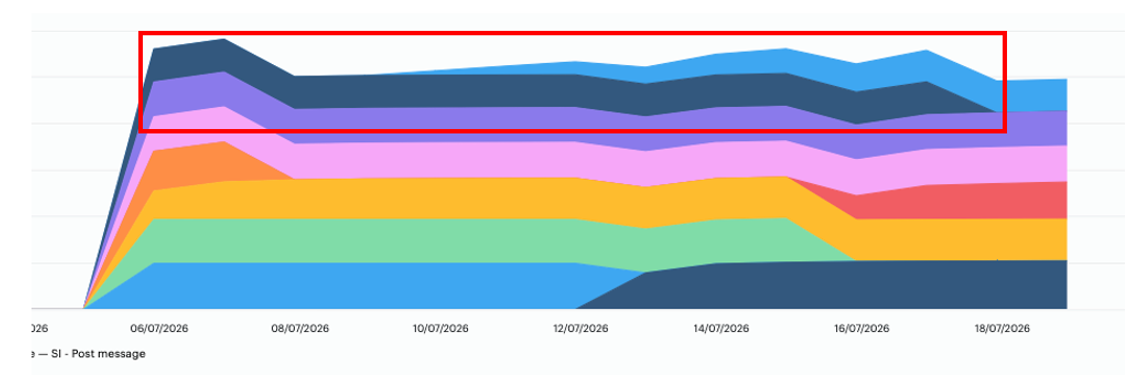
Why 30 days? Organic posts tend to follow a predictable pattern: they pick up most of their views and engagement in the first few days, then level off, with only marginal gains after that. To keep the data meaningful, and to avoid tracking posts long after they have stopped generating meaningful activity, we monitor each post for 30 days and then retire it.
In the example below, the navy blue post is no longer being tracked after 17/07/26.
Post refresh rate
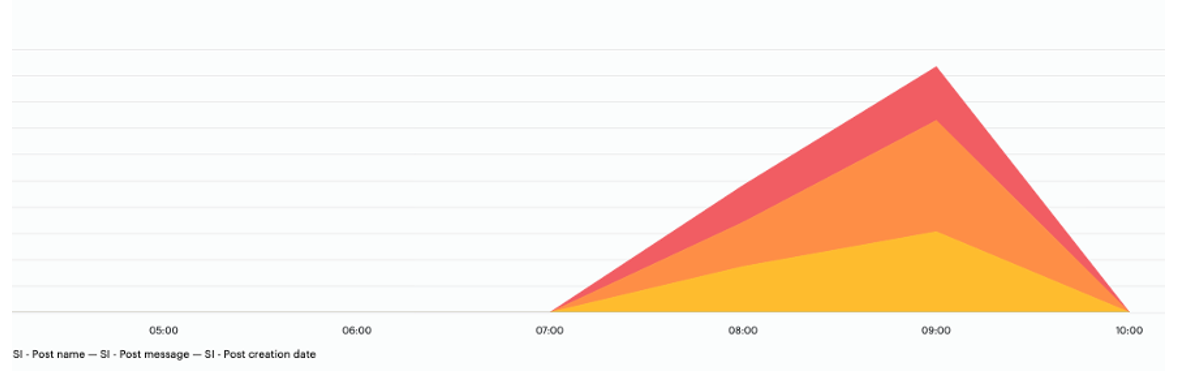
Facebook organic post data refreshes hourly. In the screenshot below, taken at 10 AM, you can see three posts published at 7 AM that had already accumulated views by 9 AM.
Board filter
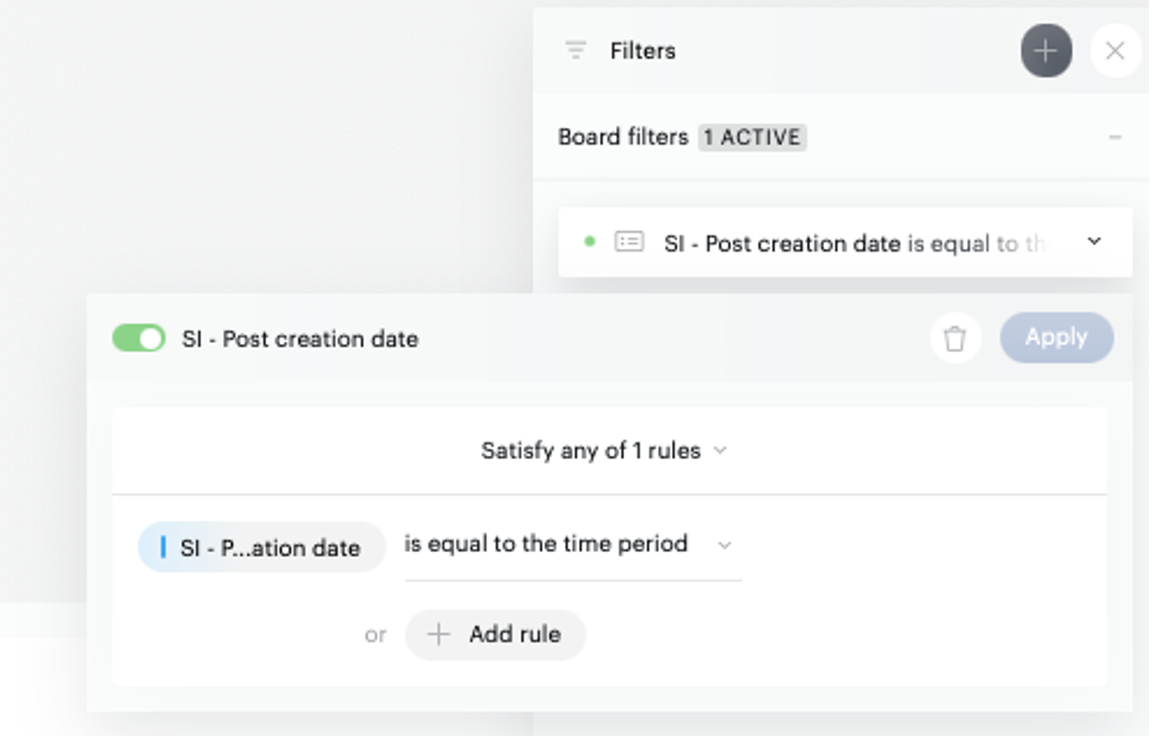
By default, boards filter posts to show only those published within the selected analysis period. Keep this in mind when comparing numbers across different date ranges: a post published just before the period starts will not be included, even if it is still accumulating views.
In summary
Taken together, these principles explain most of the questions that come up when reading Social Insights boards:
-
Numbers only go up.
-
Daily breakdowns are not available.
-
Posts stop being tracked after 30 days.
-
Data refreshes hourly.
-
Boards only show posts published within your selected period.
With that foundation in place, the next article shows how to read your board.