
Introduction
Funnel analysis allows you to track a sequence of events. You can select a sequence of events that are important to your business to identify when your users are experiencing difficulties. You can track the performance of a purchase funnel, an account creation, a subscription process, a form etc. With this information, you can improve your funnel. For example, you can create an MV Test campaign and use it as a segment to see if it was effective in improving the completion rate of the funnel.
Create your first funnel
General
There are two ways to create a funnel:
From the Library — Click the + icon in the bottom-right corner of the Library and choose Funnels.
From Data Query — Open the Open menu in the top-right corner and choose Create new funnel.
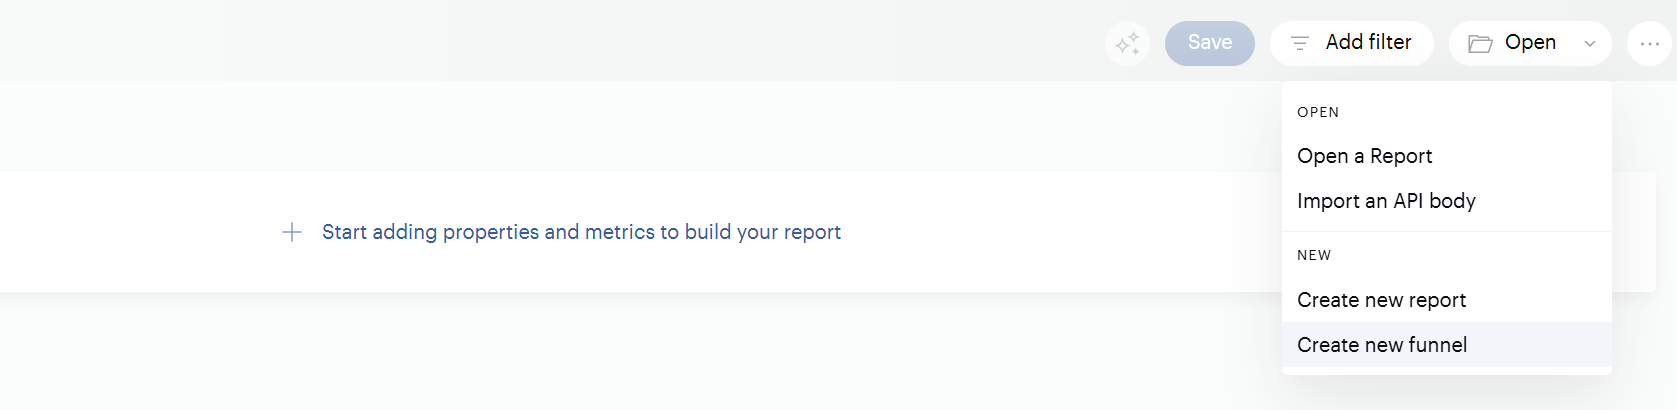
Both options take you to the funnel creation screen:
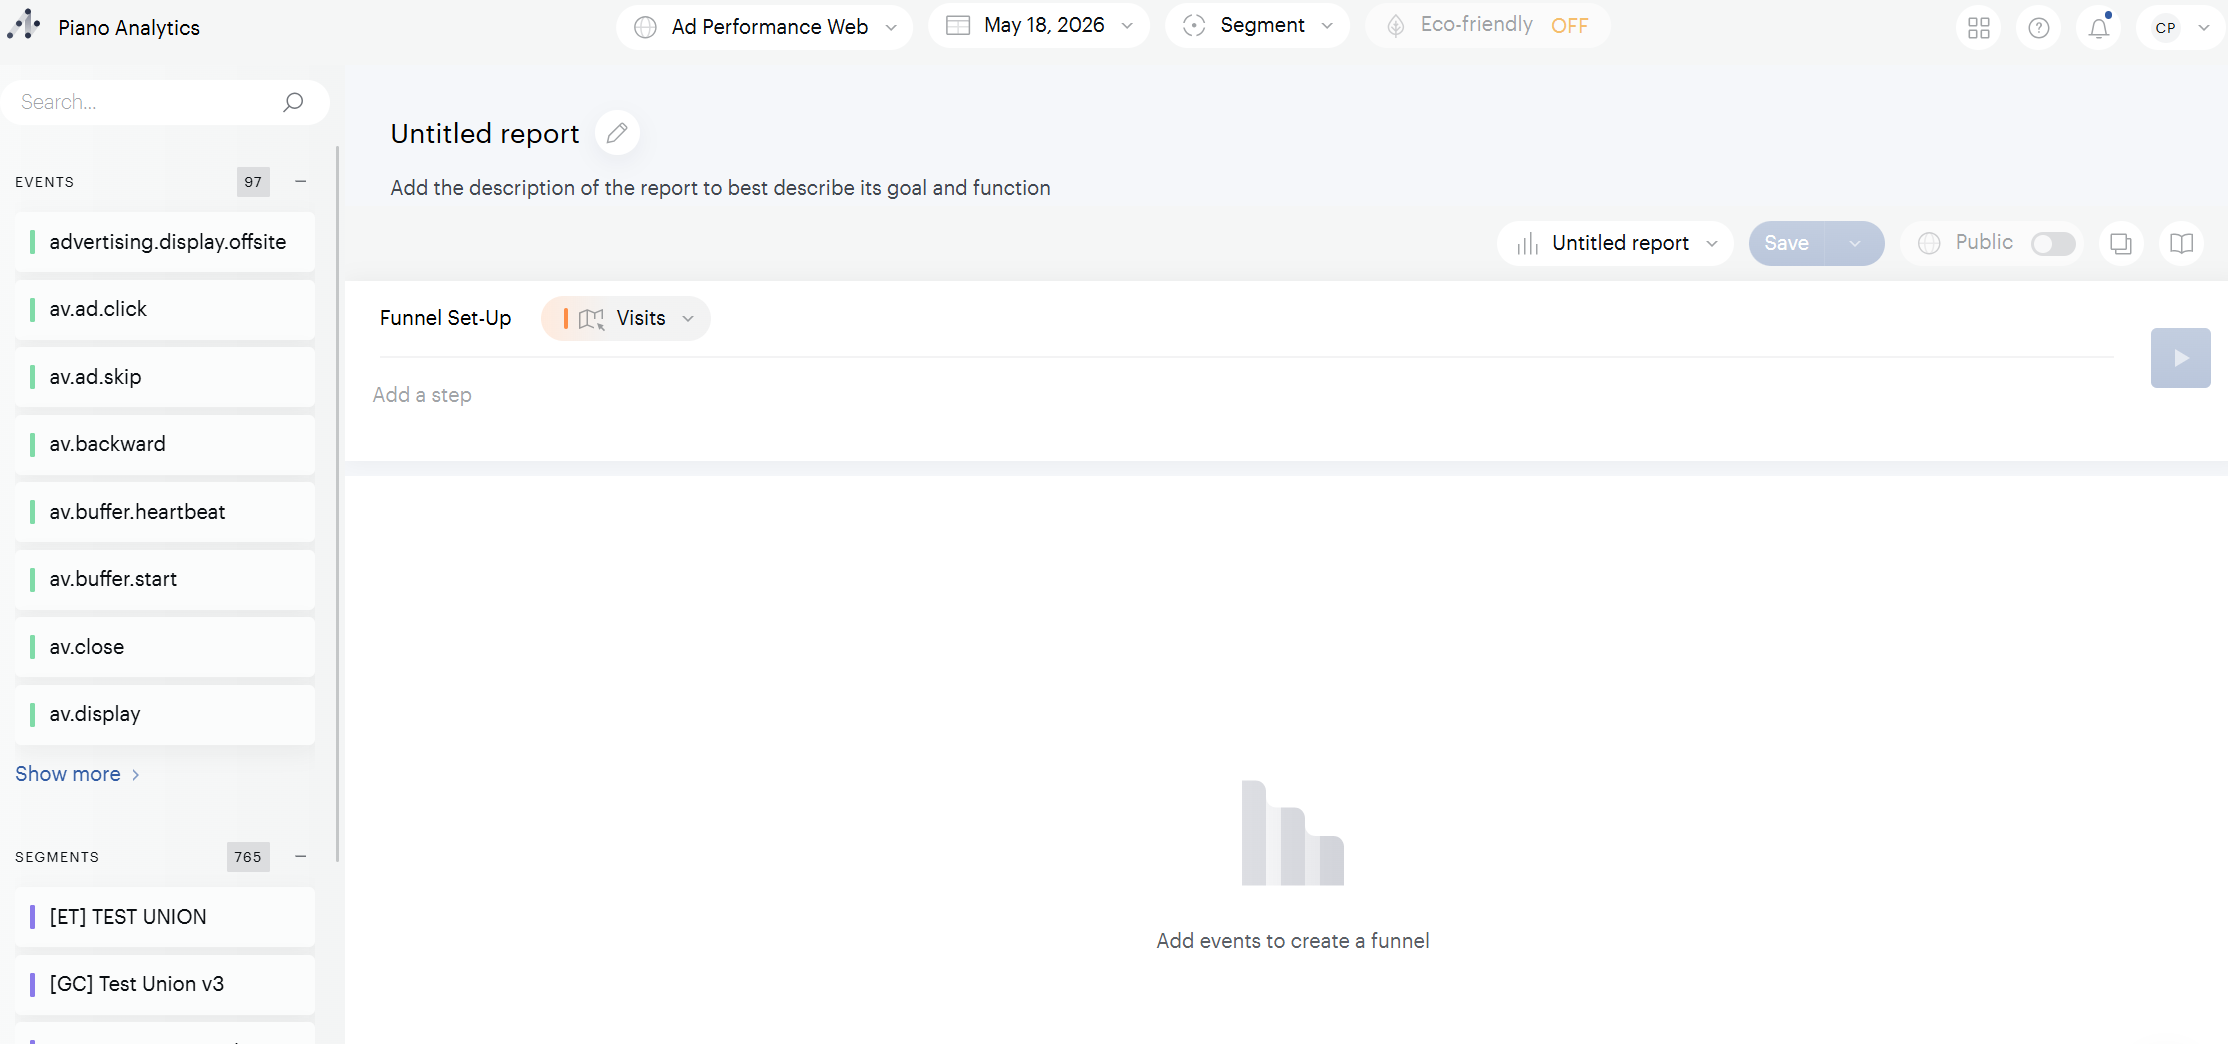
Important things to note:
-
The side menu lets you select an event to add as a step — just double-click on it.
-
The upper central area contains several elements:
-
The funnel scope drop-down (set to Visit by default). This defines the scope across which all configured steps must be performed:
-
Visit — all steps must be completed within a single visit.
-
Visitor — all steps must be performed by a single visitor, regardless of the number of visits.
-
User — all steps must be performed by a single user, regardless of the number of visits or visitors.
-
-
The funnel configuration area, which shows "Add a step" by default. Click it to start configuring a new step.
-
The two buttons on the right — one to launch the funnel and display results, one to retrieve the API call.
-
Create a step
As you may have guessed, it is possible to create a step using the side menu or the central area. No matter which method is used, the result will be the same. Here is an example of creating a step using the central zone and selecting two events.
You can select a single event, multiple events, or all events for a step.
Once you've selected your events, you may want to refine the step with filters. For example, if you select the page.display event, you'll likely want to focus on specific pages rather than your entire site.
To add a filter:
-
Right after adding an event — The filter panel opens automatically.
-
At any time after — Click the options menu (three dots) on the step and select Filter.
The example below shows how to filter the step to include only pages where the Page property equals shop.
You can continue the configuration of the funnel and add several steps. Once finished, you will have to launch the funnel via the button on the top right.
Apply a segment
You can apply a segment to your funnel to analyze the behavior of a specific audience — for example, mobile users, paying subscribers, or visitors from a particular campaign.
To apply a segment, use the segment selector in the top bar. The funnel results will then reflect only the visits, visitors, or users included in the selected segment, depending on the funnel scope.
Using the breakdown
Once a funnel has been created, you can apply a breakdown to study the performance of your funnel according to a given property. For example, you want to identify if your funnel performs as well on different device types.
How does the breakdown work?
We test on the first step the values of the selected property, then based on this value we look at how the funnel performed on the following steps. It is therefore necessary that the value of the property you are analyzing is filled in on the first stage, but it is not necessary that it be filled in on the following stages.
Analyze and understand the results
Once your funnel is built and the results are displayed, here's how to read them.
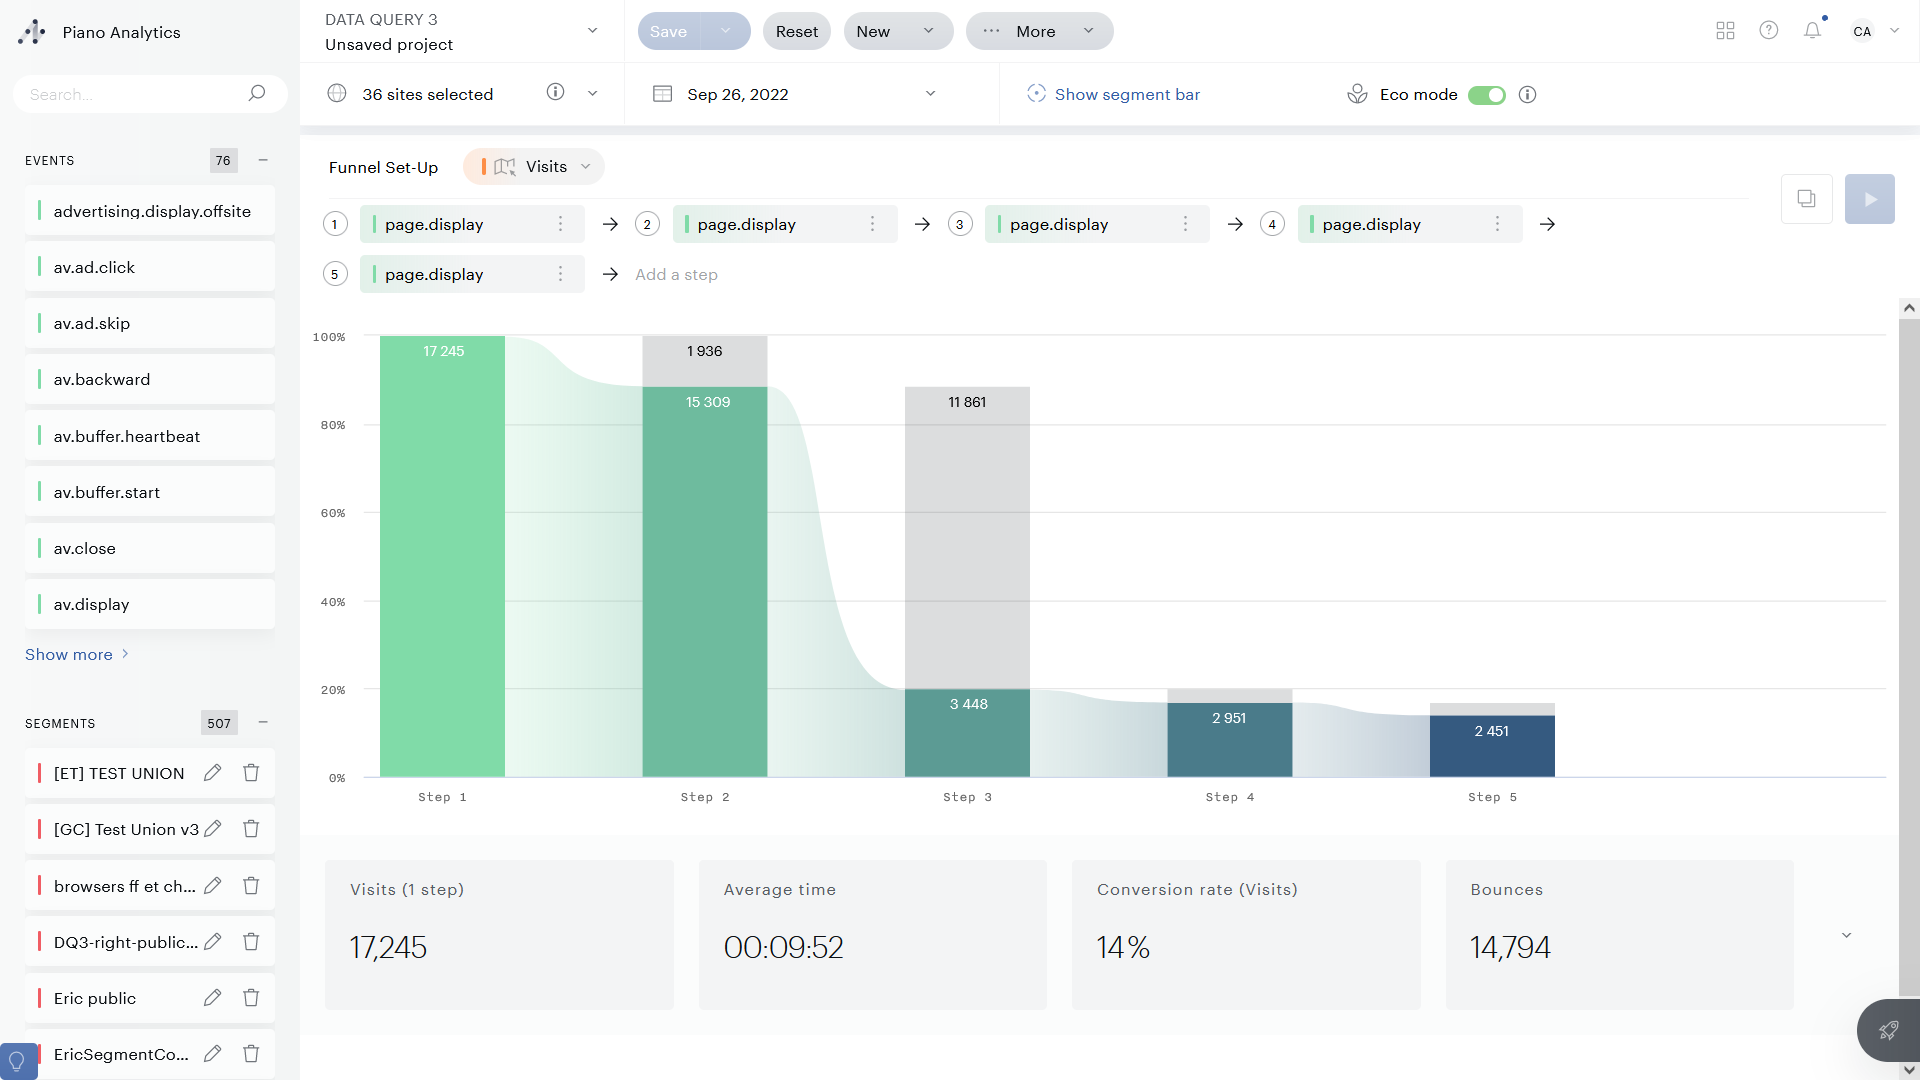
The colored area represents the visits, visitors, or users moving through the funnel, depending on the scope. The grey area shows those who entered the previous step but didn't reach the current one.
In the example below (scope set to Visit):
-
17,245 visits entered the funnel
-
15,309 reached step 2
-
3,448 reached step 3
-
2,951 reached step 4
-
2,451 completed the funnel
💡 Tips
-
If a bar is too small to read, hover over it to see its value.
-
Click on any step bar to open a detailed pop-up with the number of converted and outgoing visits, plus step execution time (minimum, average, maximum).
Funnel KPIs
Below the graph, you'll find a set of KPIs based on your funnel configuration:
-
Visits (1 step) — The number of visits, visitors, or users that entered the funnel.
-
Average time — How long it takes, on average, to complete the funnel.
-
Conversion rate — The number of visits on the last step divided by the number on the first step.
-
Bounces — The number of visits, visitors, or users who entered the funnel but didn't complete it.
Click the arrow to reveal two additional metrics: the maximum and minimum completion times observed over the period.