Using the Month property alone won't work — months sort alphabetically by default (April, February, January, March…), not chronologically. To get a proper monthly view, combine Month with Month number and sort on the number.
Here's how to set it up:
-
Select your time period. Open the date selector at the top and choose either the current year (e.g., 1 Jan 2026 – 20 May 2026) or the previous year, depending on what you want to analyze.
-
Add the following properties and metric to your report:
-
Month number (property) — used for sorting.
-
Month (property) — used for display.
-
Events (metric) — or the visit-related metric you want to measure (e.g., Visits, Page views).
-
-
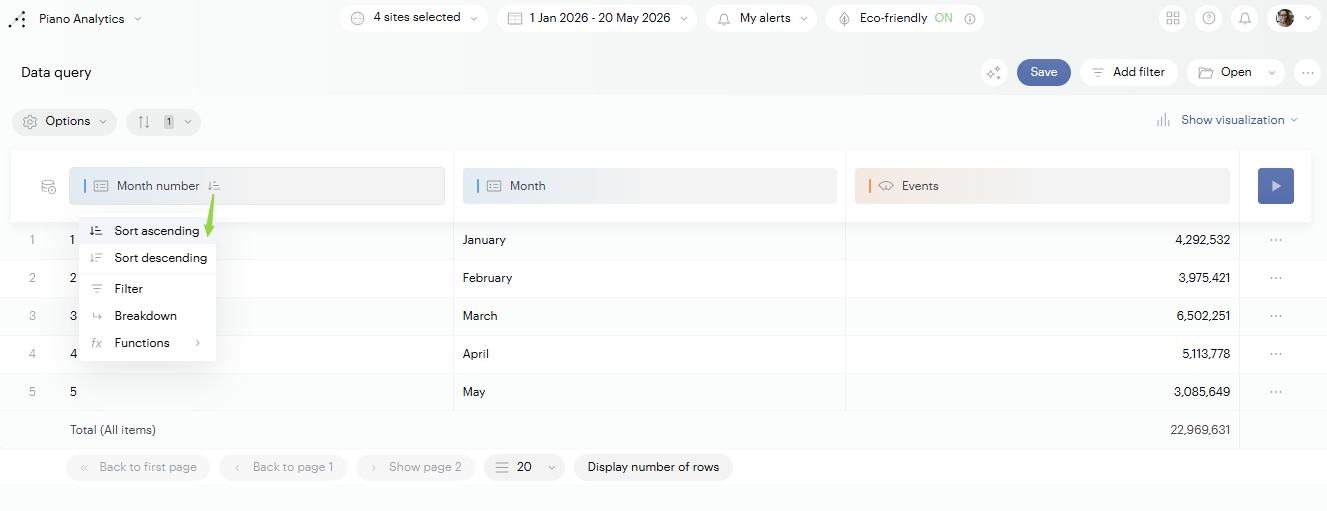
Sort by Month number, ascending. Click on the
Month numbercolumn header and select Sort ascending. This orders the rows from January to December. -
Run the report. Click the ▶ button on the right to generate the table.
You'll now see one row per month, in chronological order, with the corresponding metric values.