
Action required: migrate from the AT Internet – DELTA connector
Following recent changes to Google's guidelines, the AT Internet – DELTA Data Studio connector is no longer operational and cannot be restored.
-
If you already use the Piano Analytics connector, no action is needed.
-
If you use the AT Internet – DELTA connector, you need to migrate to the new Piano Analytics connector. See Migrating from the AT Internet – DELTA connector below.
Note on naming: In April 2026, Looker Studio was renamed back to Google Data Studio.
About Data Studio
Data Studio, part of Google marketing Platform and closely integrated with Google Cloud, allows you to easily access data from Google Analytics, Google Ads, Display & Video 360, Search Ads 360, YouTube Analytics, Google Sheets, Google BigQuery and over 500 more data sources, both Google and non-Google, to visualize and interactively explore data.
Beyond just sharing, Data Studio offers seamless real-time collaboration with others—whether you’re sitting across the room, or across the world.
Learn more at https://datastudio.google.com/ .
PA Connect Data Studio
This integration allows you to easily import data from Piano Analytics into Google Data Studio. Explore, transform and combine Piano Analytics data with hundreds of sources available in Data Studio.
Thanks to this integration you can create meaningful and easy-to-follow reports in just a few clicks. Collaborate with your team to create dashboards that inspire smarter business decisions.
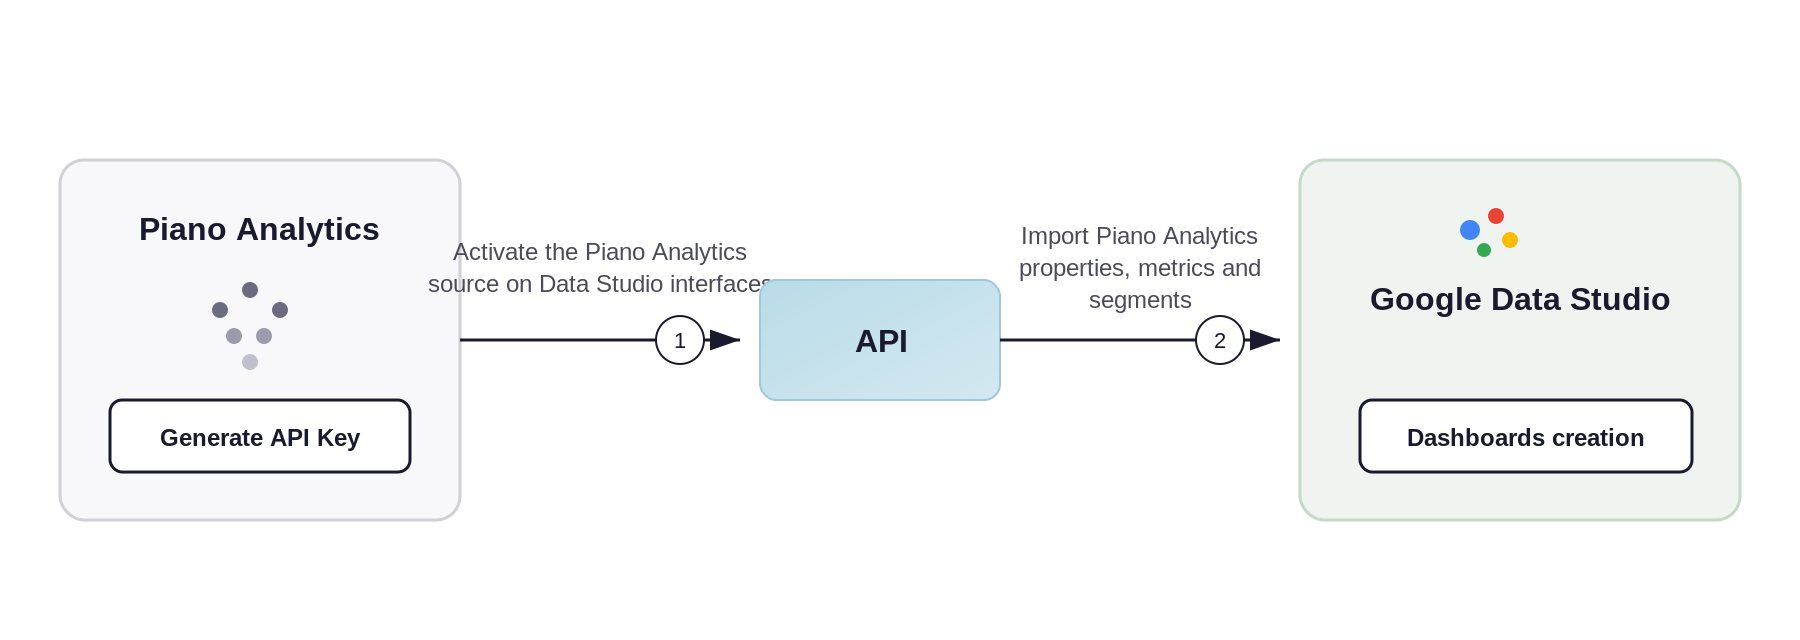
Connector principles
The PA Connect Google Data Studio allows you to export Piano Analytics data to create custom dashboards. You can also cross Piano Analytics data with other data sources available in this Google platform. The activation of the connector needs two steps:
-
The first step is to generate an API key from your Piano Analytics user profile. You’ll have to paste this key into Google Data Studio interface.
-
The second step takes place in Data Studio. You must choose the right data source of Piano Analytics, allow the Piano Analytics application through Google authentication, and activate the connector by pasting your API key.
API Key creation from the user profile
You must create an API Key that will allow you to activate the connector. You must therefore access your user profile in order to create this key. Please find every information on the following documentation: API Keys . For information, you must have a level of access rights "Analyst" at least to be able to generate this API.
Connector activation in Data Studio
Selecting the Piano Analytics data source
To enable the connector, select the Piano Analytics data source in Data Studio. Go to https://datastudio.google.com/ and open Create > Data Source from the left menu.
Use the search bar to find the data source. The following sources are available:
-
Piano Analytics — The current connector, based on API v3, with the latest fixes and features. Use this one.
-
Piano Analytics (AT Internet) — A third-party, paid, connector developed by Supermetrics, based on API v3. It doesn't support importing custom properties and metrics.
The AT Internet – DELTA data source is no longer operational. Customers who previously used this data source must migrate to the Piano Analytics connector (see below).
You can then choose the right Piano Analytics data source to enable the connector and proceed to the next step. A search engine helps you to quickly reach the desired data source.
Migrating from the AT Internet – DELTA connector
If you have existing Data Studio reports built on the AT Internet – DELTA connector, you'll need to switch each report's data source to the new Piano Analytics connector.
To migrate a report:
-
Open the report in Data Studio.
-
Add the Piano Analytics connector as a new data source. Follow the steps above to authorize the connector and configure it.
-
For each tile in the report, change the data source from AT Internet – DELTA to the new Piano Analytics source.
-
Verify that each tile displays the expected data, then remove the old AT Internet – DELTA data source from the report.
If a tile shows an error or unexpected data after switching, double-check the field mappings — the new connector may use slightly different field names for some metrics and properties.
Authorize the Piano Analytics application
In order to work properly, Data Studio requests permission to use the Piano Analytics Connector. You must then allow the Piano Analytics application through Google Authentication.
Paste your API Key, and choose your Piano Analytics site and segment
In this last step you have to paste the API Key generated from the Piano Analytics interface. Data Studio will then be able to recover your Piano Analytics data.
Be careful to associate the Access Key and the Secret Key with an underscore "_" before pasting the information into Google Data Studio.
Example: Accesskey_Secretkey (xxxxx_xxxxxxxxxxx).
Choose your Piano Analytics region, site and segment
You must select the region in which your Piano Analytics data is stored:
.png?cb=1ded0f67053909c108080f721918ad77)
If you do not have this information, please contact your Account Manager.
If no choice is made, the Europe will be the selected region by default.
In case of a wrong choice, your board will display no data due to incorrect API endpoint. Your board widgets will display the following error message: “Data failed to be retrieved. Check your credentials and your region”.
Then select the site concerned by this new Dashboard:
Before validating the data source, the latest version of the connector lets you import your Piano Analytics segments into your reports.
Selecting a segment from this configuration menu will apply that segment to your entire Data Studio board and cannot be removed afterwards. If you plan to apply different segments to several boxes in your report, please leave the selection empty and check the “Allow ‘Segments’ to be modified in reports” box:
Dashboard creation in Data Studio
Once the connector has been selected, you can edit the imported properties and metrics. Various options are available: rename, delete, choose data type, aggregate, modify description, add a field...
Once you've set the parameters, click on “Create report” in the top right-hand corner to start creating a dashboard:
.png?cb=bb3aa22df930418dfa3e850ed7431d20)
All that is left to do is create dashboards based on Piano Analytics data, and combine them with other data sources if needed. You can also collaborate with others on these dashboards, sharing them whenever you like via a link, PDF or email.
.png?cb=dd1438475a038c0a734ca2f759047323)
Retrieve your Piano Analytics segments
To apply one of your segments to a box in your report, scroll down your box's configuration menu to the “Parameters” section. The selector contains all your Piano Analytics segments:
It is of course possible to apply a different segment to each box.
Tips and tricks
Tips 1
For information in Data Studio you can add charts from different sources in the same Dashboard (multiple Piano Analytics sites and other sources). You must go to the right side of the screen to edit / add a data source.
By clicking the "Blend Data" button, you can easily manage your different data sources, named as "tables" in the editing menu:
Tips 2
In Piano Analytics you have the possibility to create and save your own custom metrics. Here is an example with a custom metric "m_events_per_visitors".
After saving it, this metric is now available in your Piano Analytics ressources:
In Data Studio you must refresh the Piano Analytics data source to integrate the custom metric you just created. To do this you must click on the source editing pencil (right panel), then you click on the data refresh button (bottom left) and finally you must apply the changes.
Specificities of the bridge
Some of the connector' specificities are detailed in our dedicated article:
Google Data Studio connector: limitations and new features